| Metric | 2% | 5% | 10% | 20% |
|---|---|---|---|---|
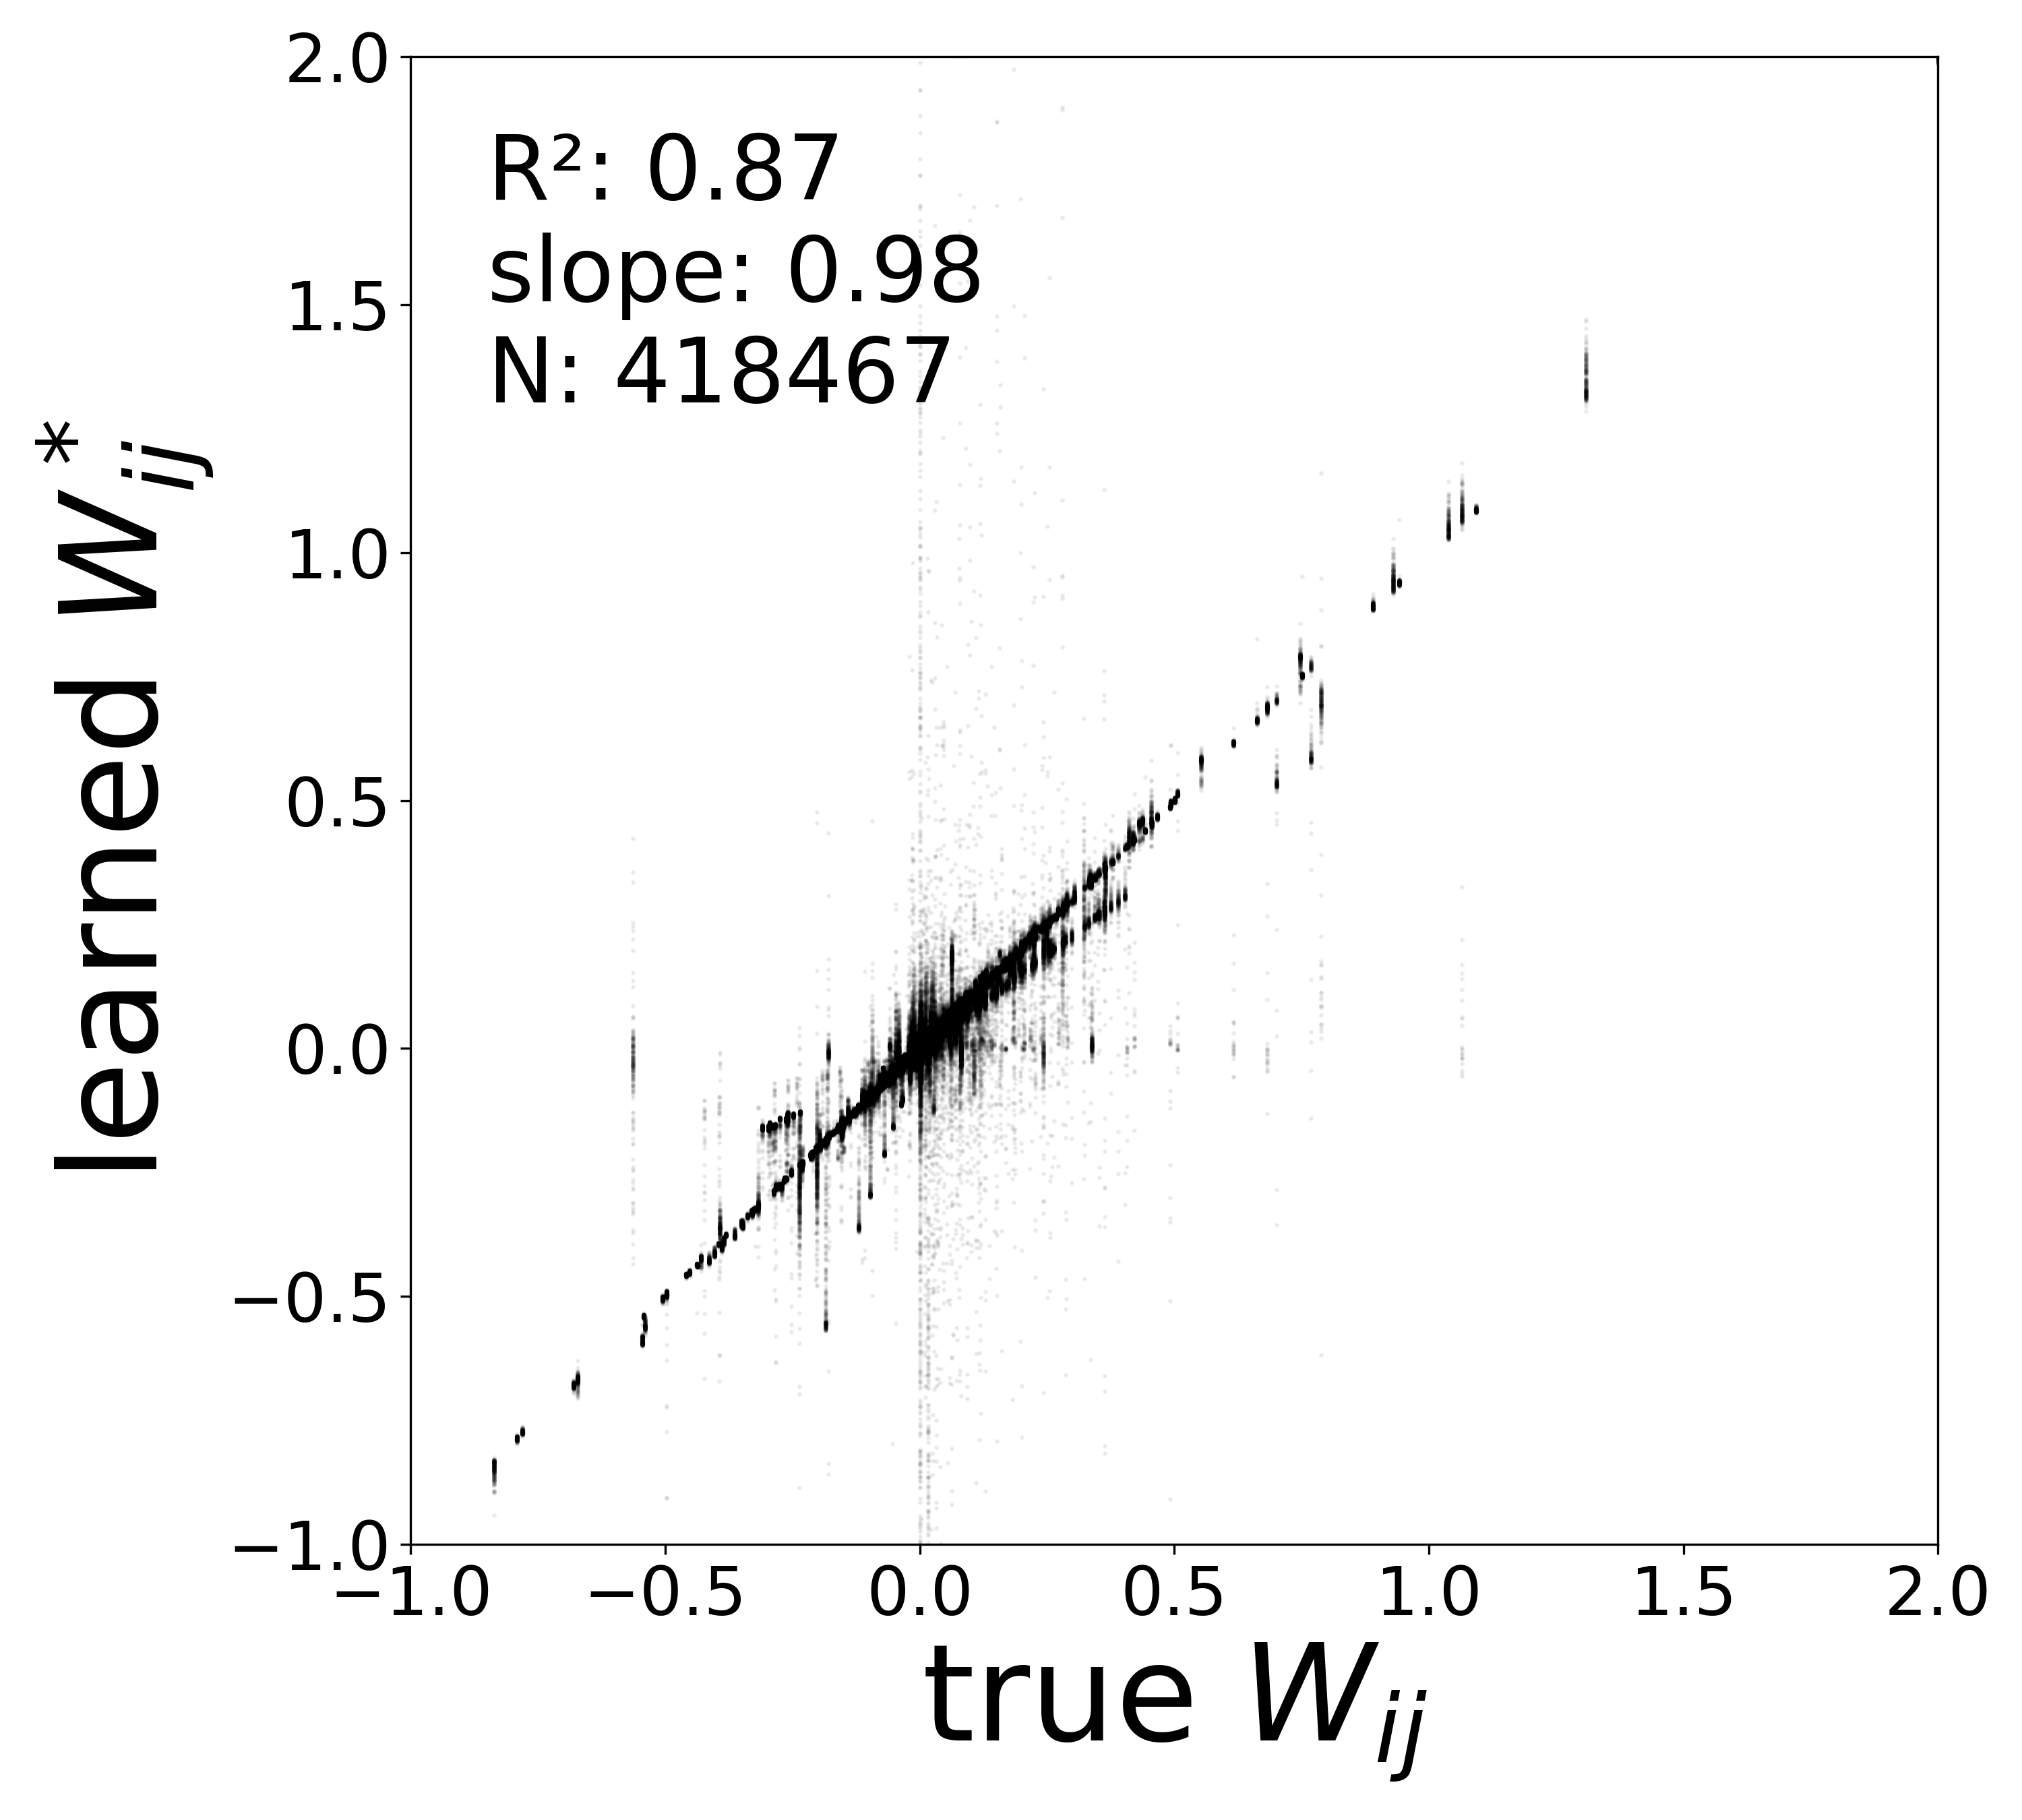
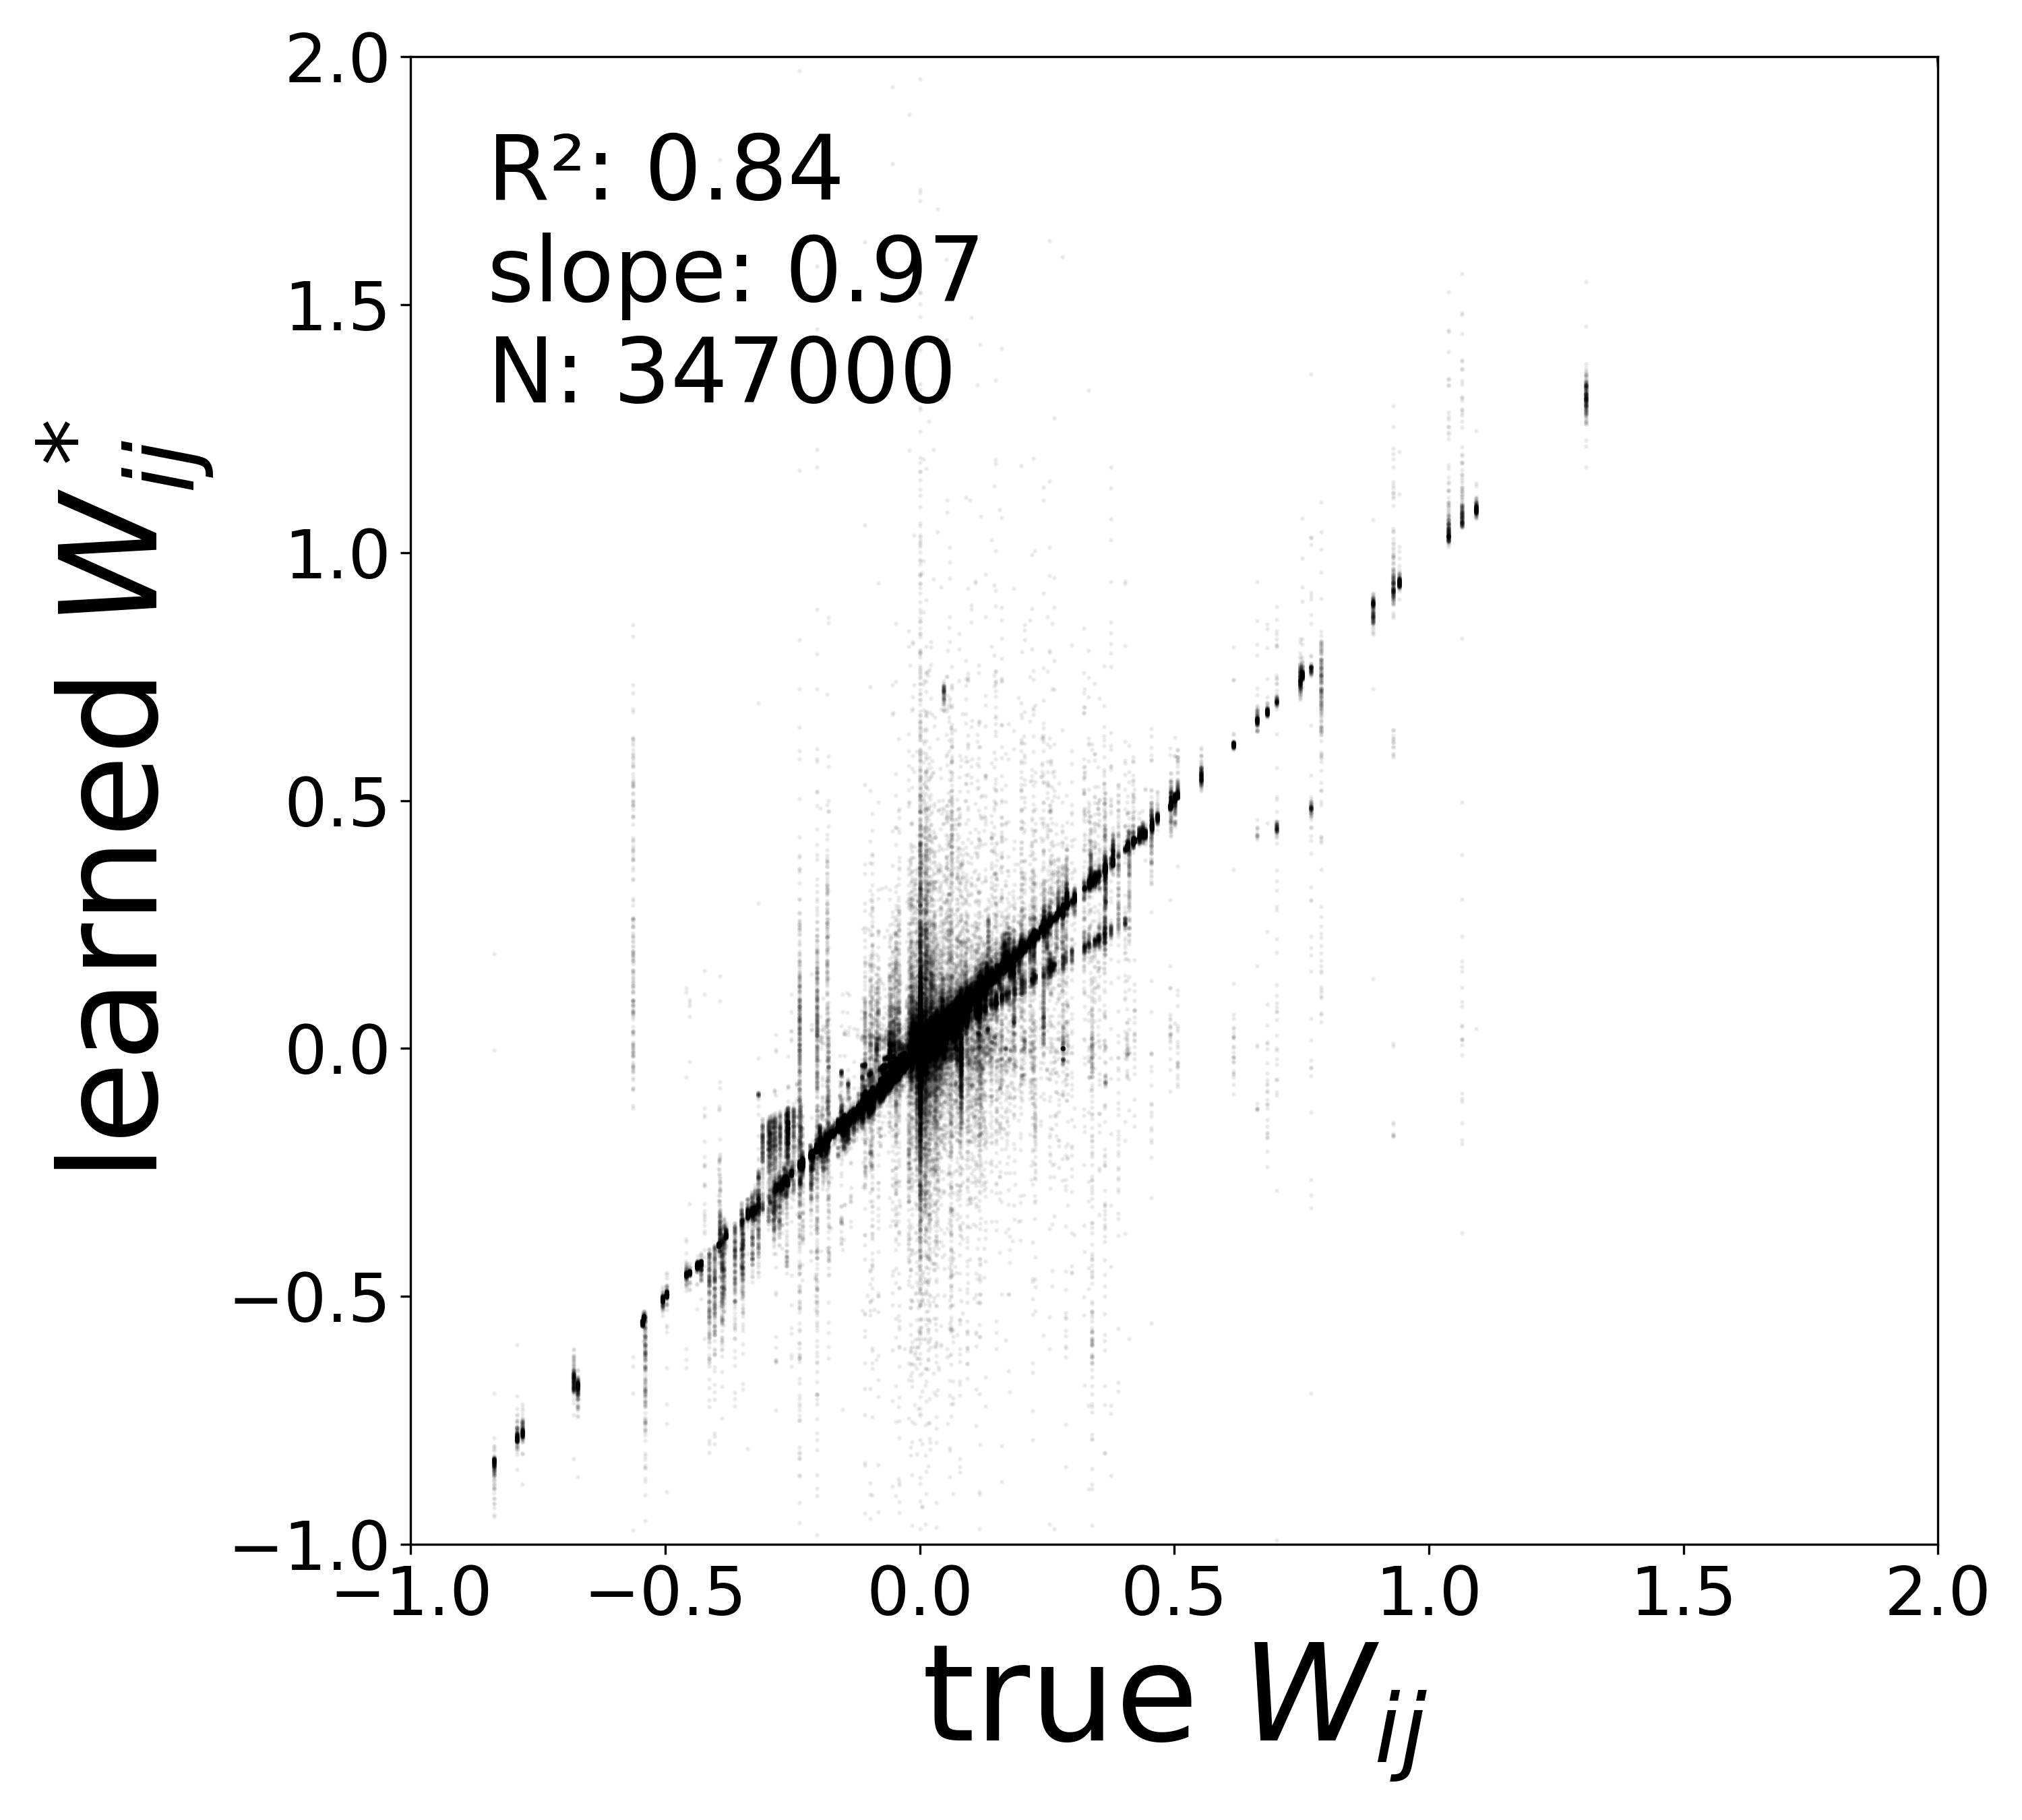
| \(W\) corrected \(R^2\) | 0.8721 | 0.8413 | 0.8042 | 0.8367 |
| \(W\) corrected slope | 0.9778 | 0.9752 | 0.9865 | 0.9674 |
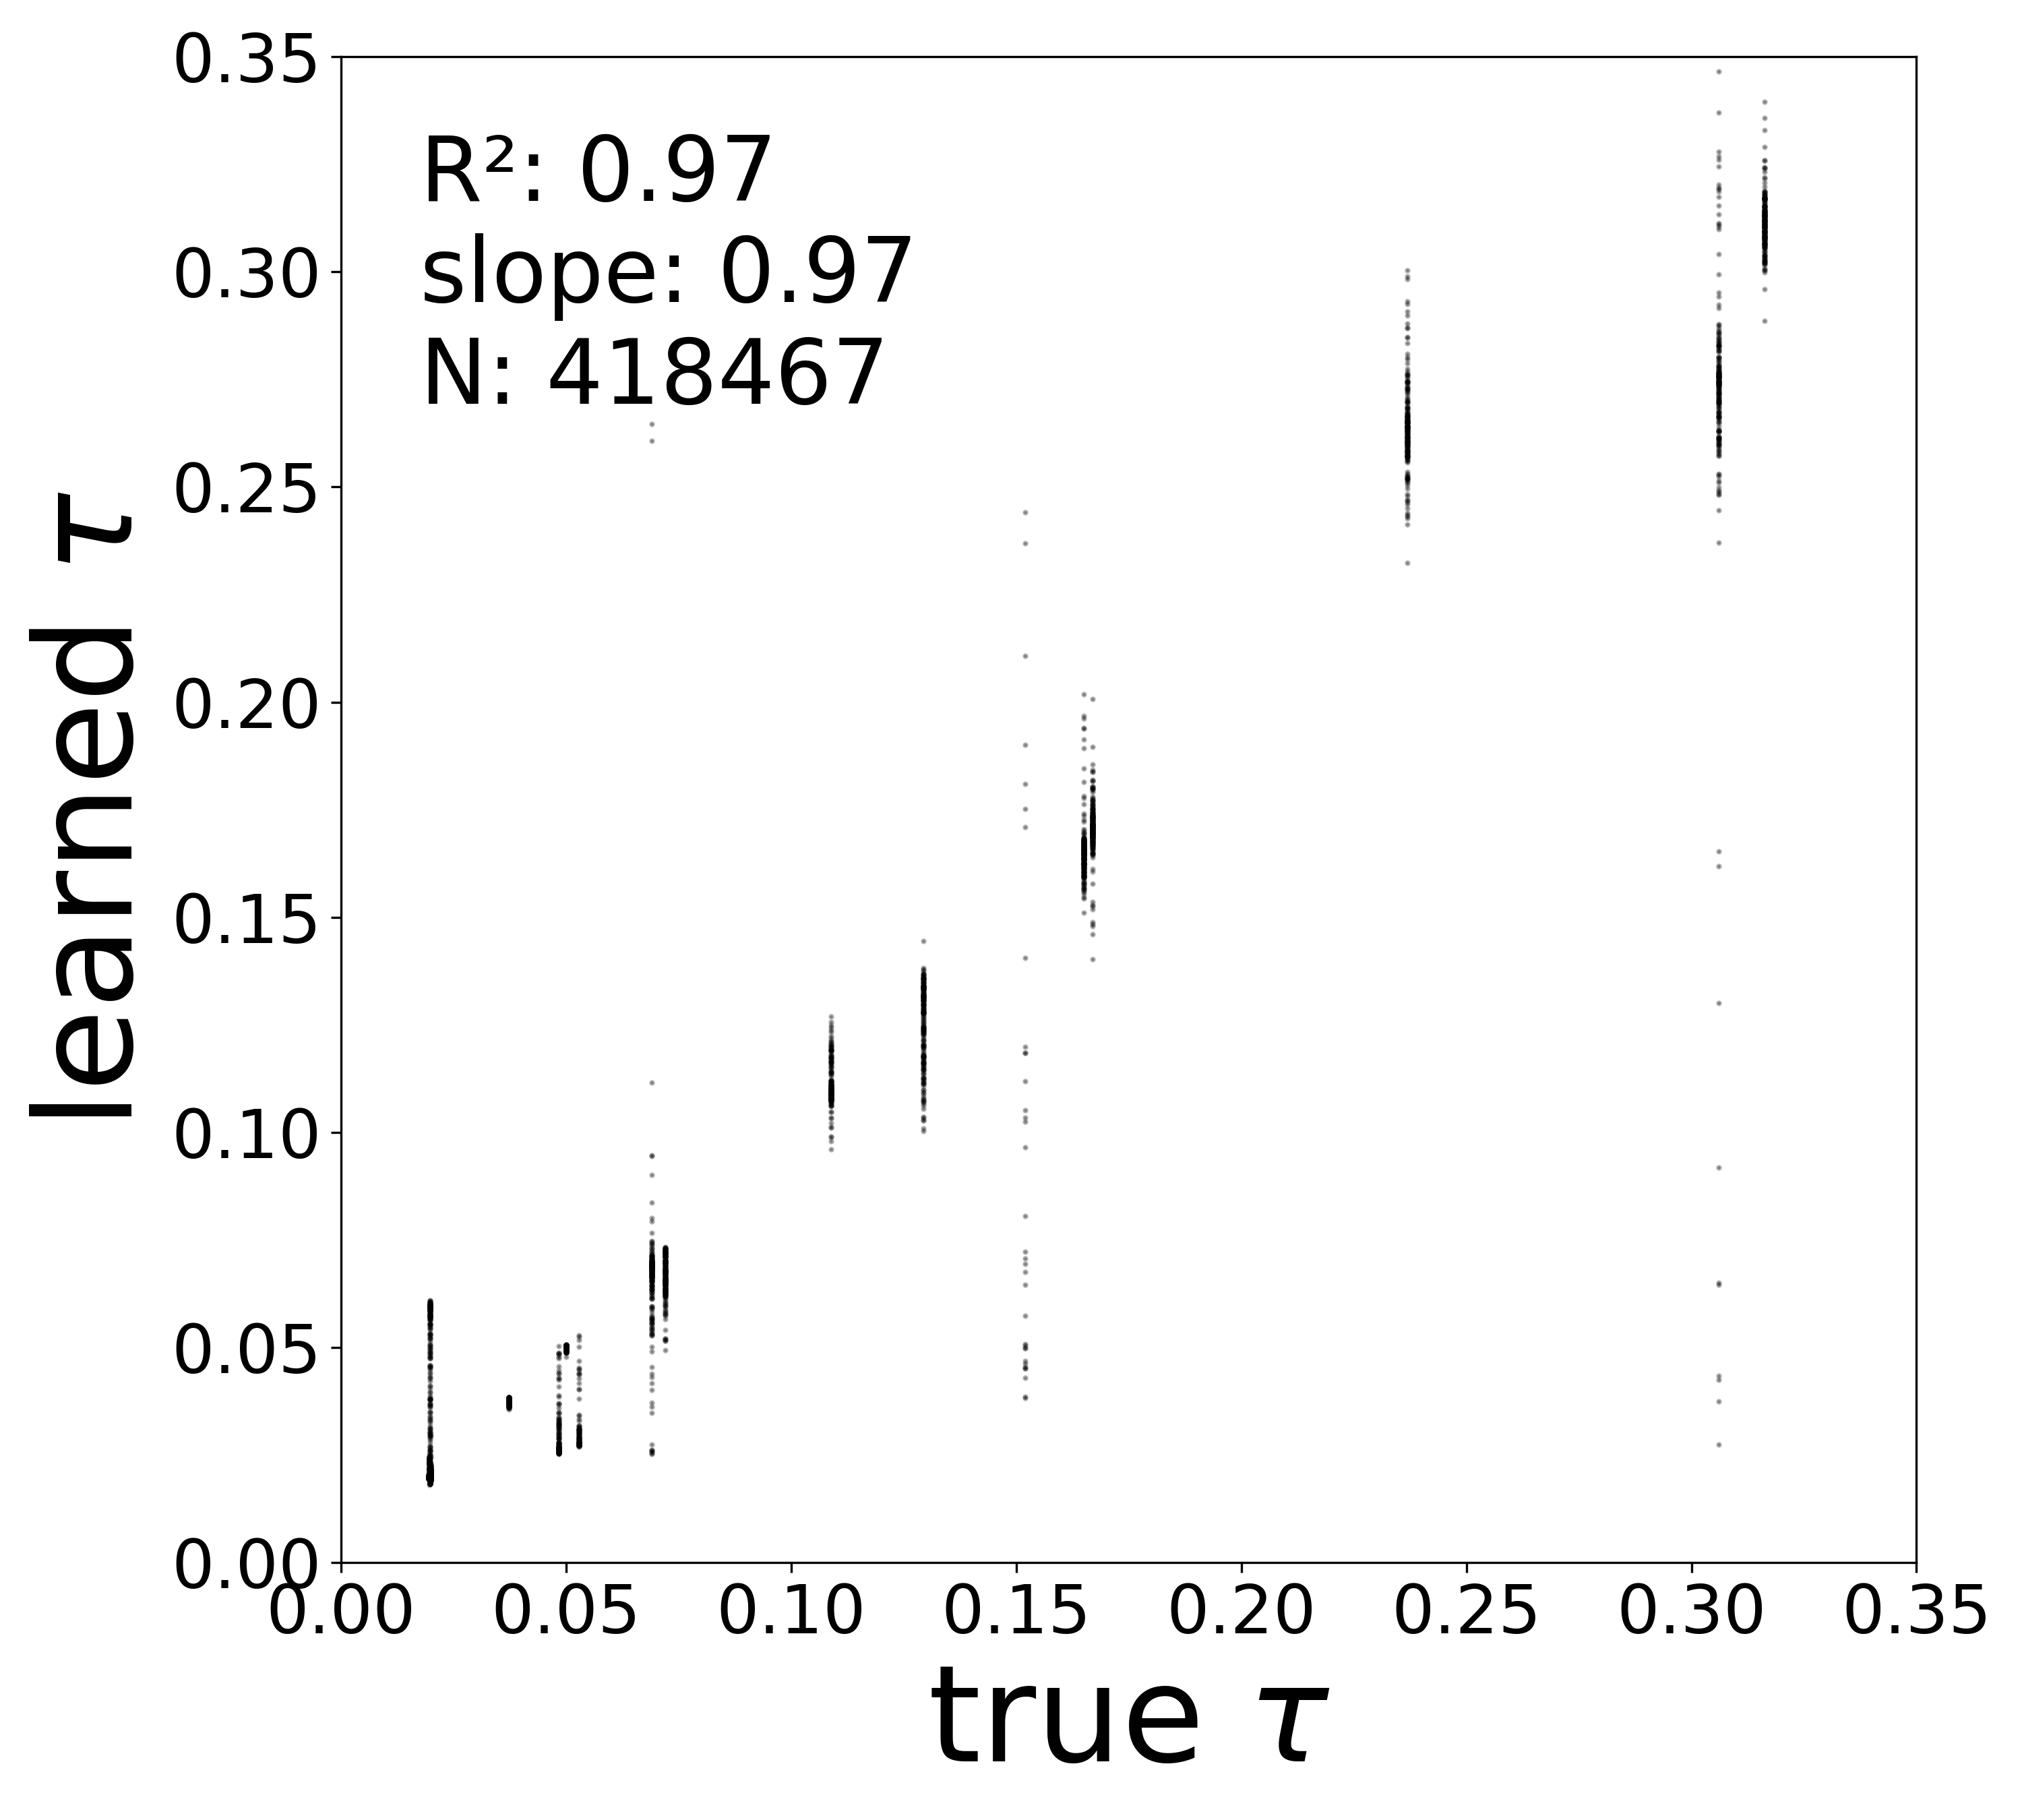
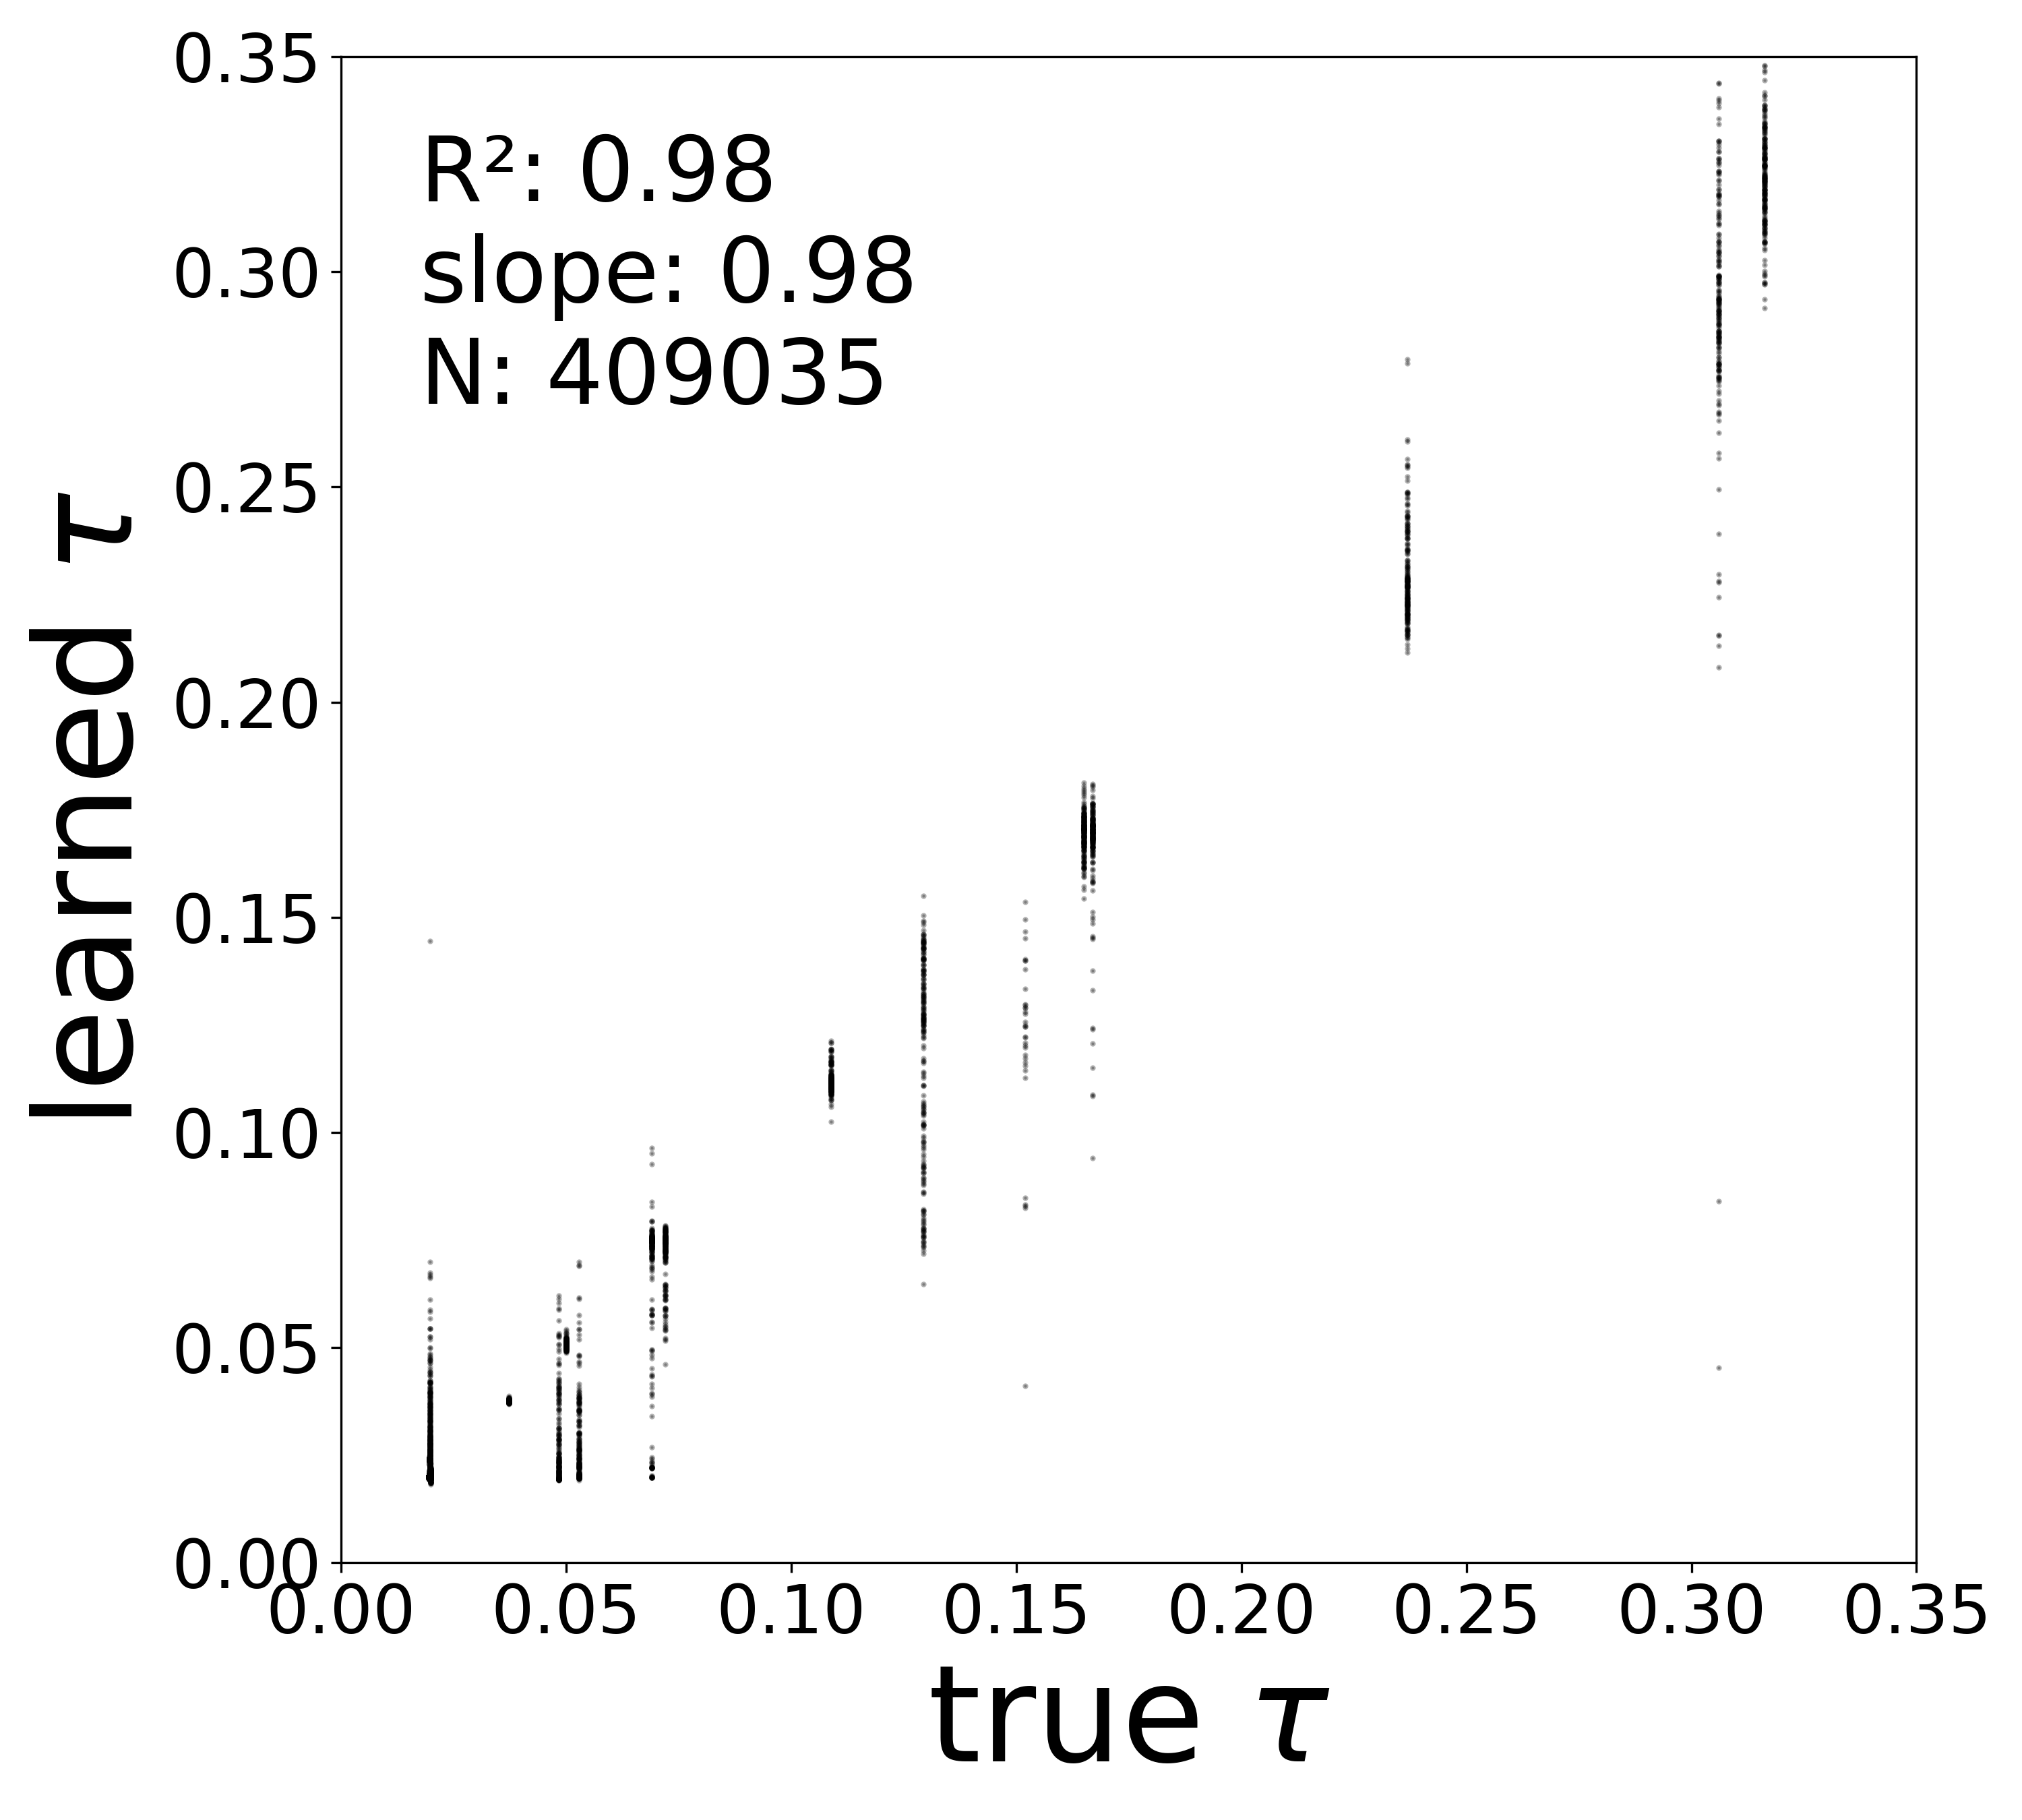
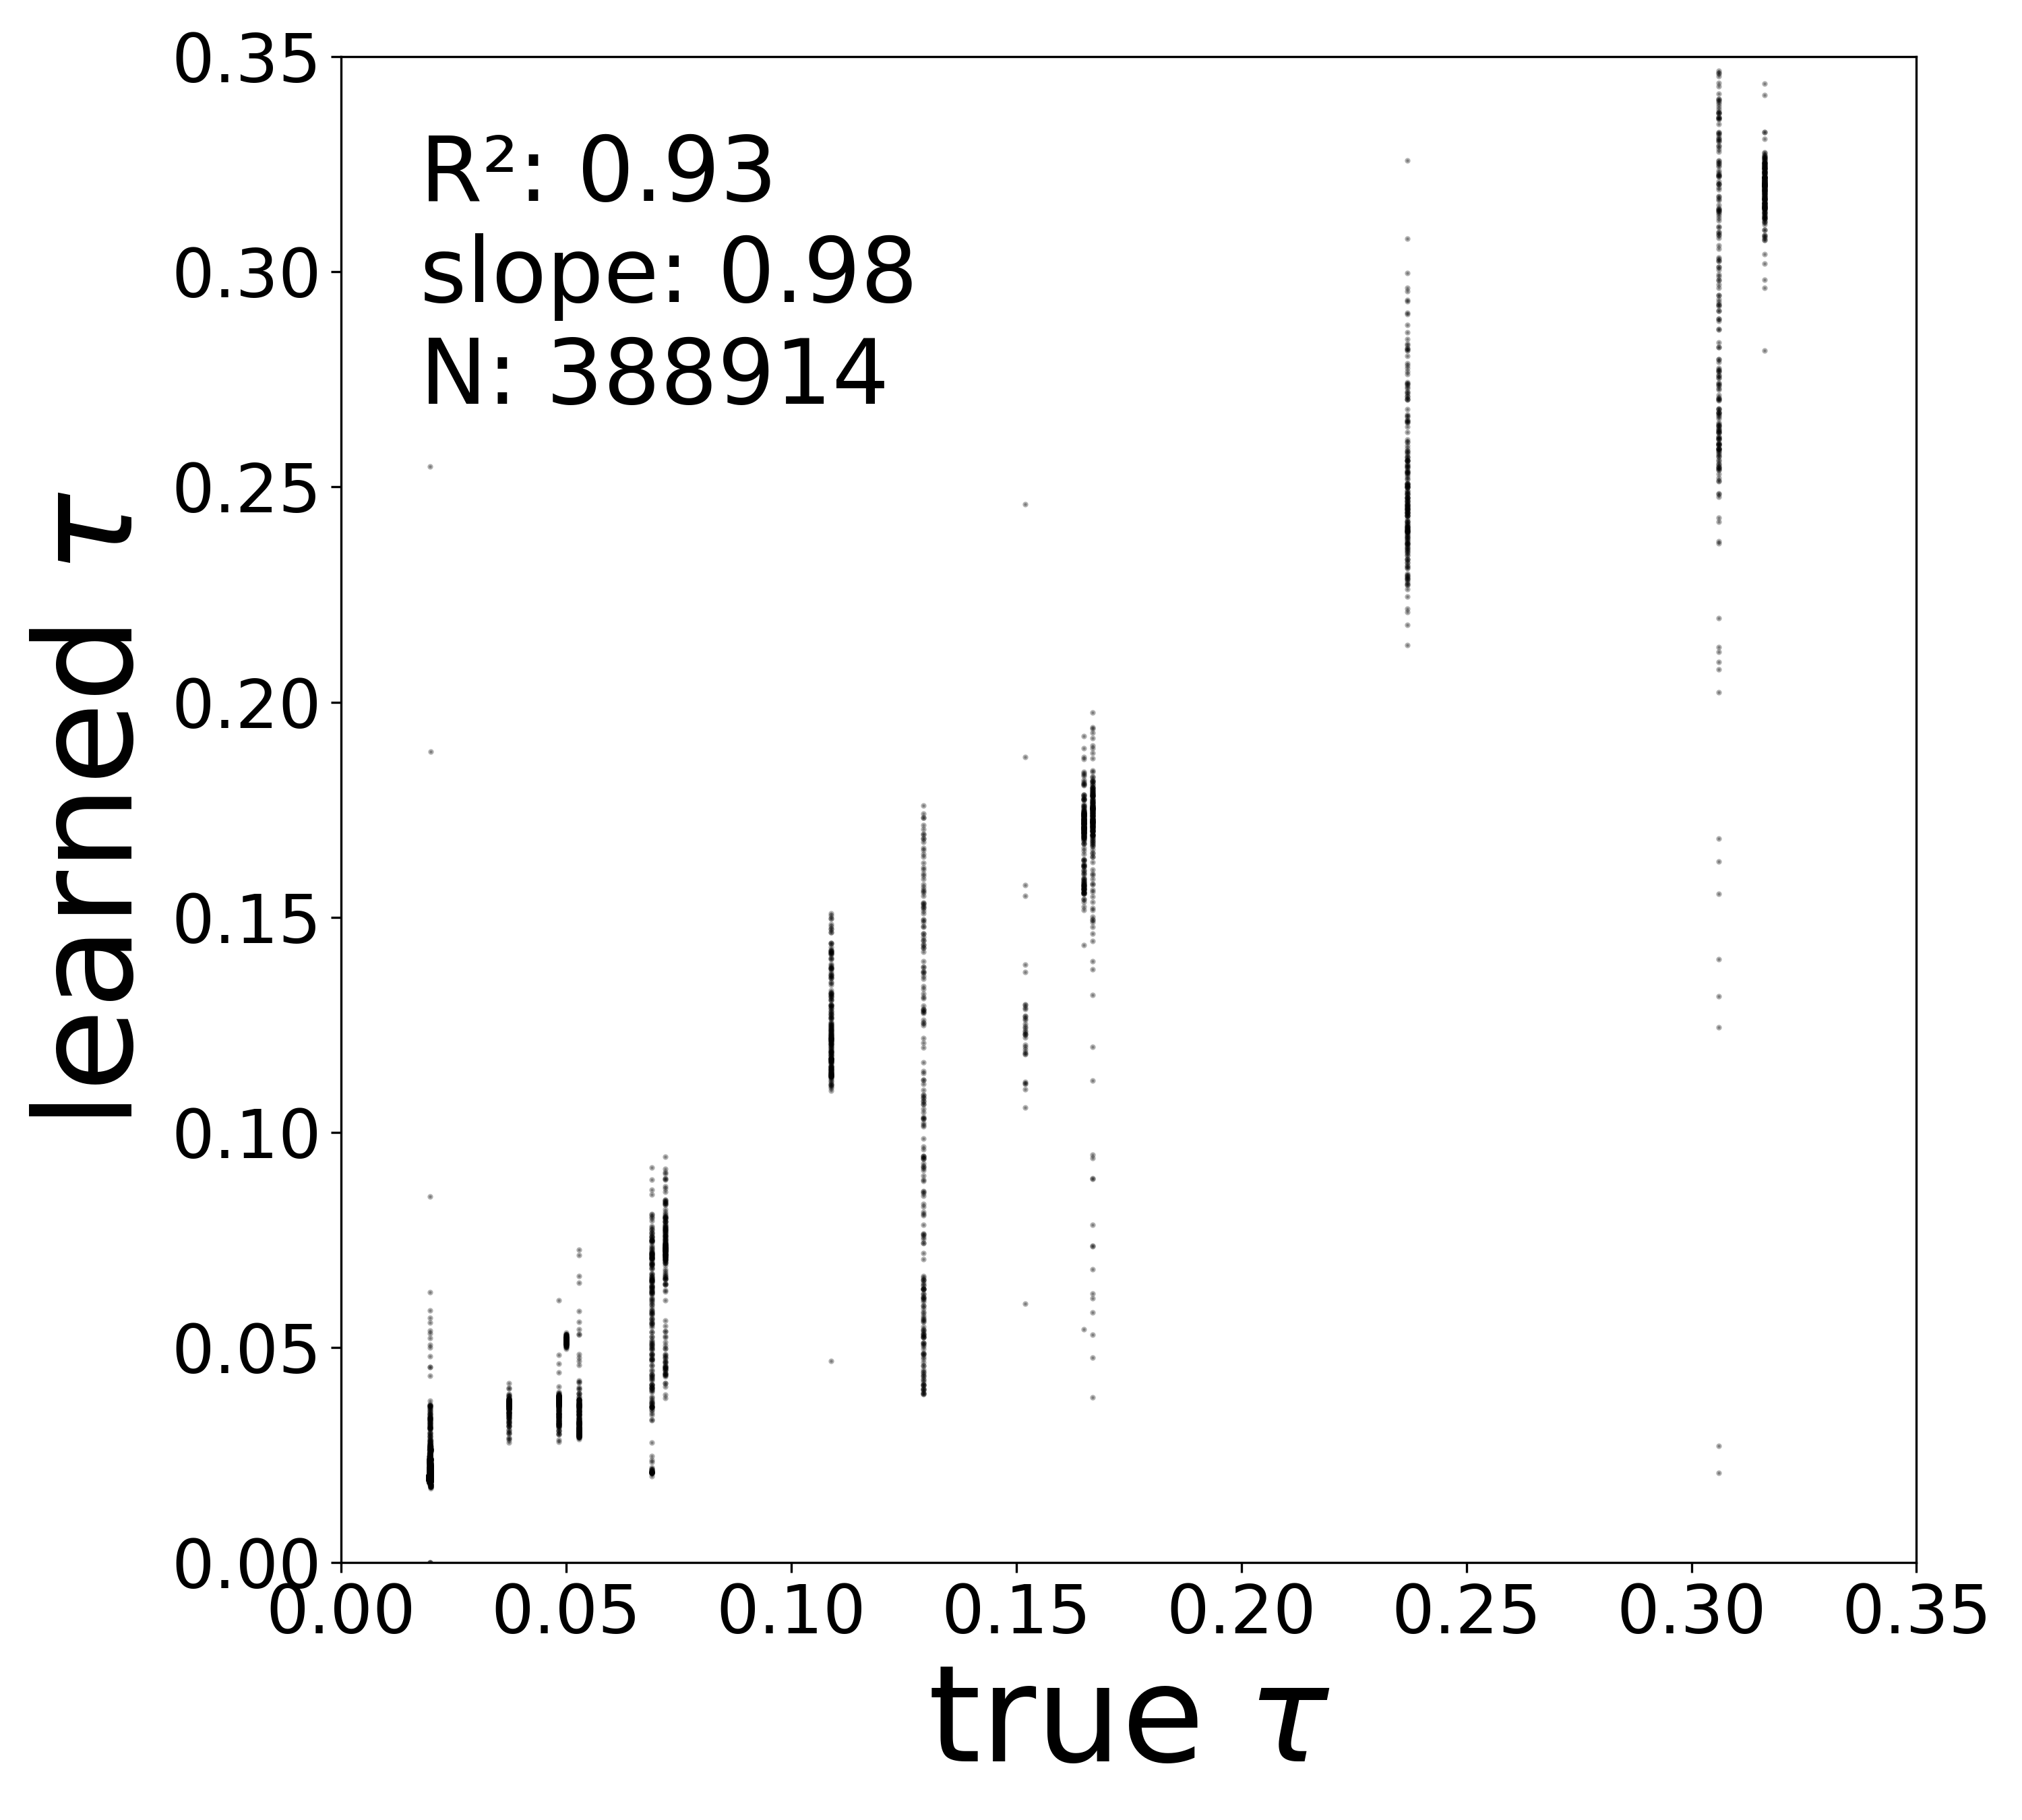
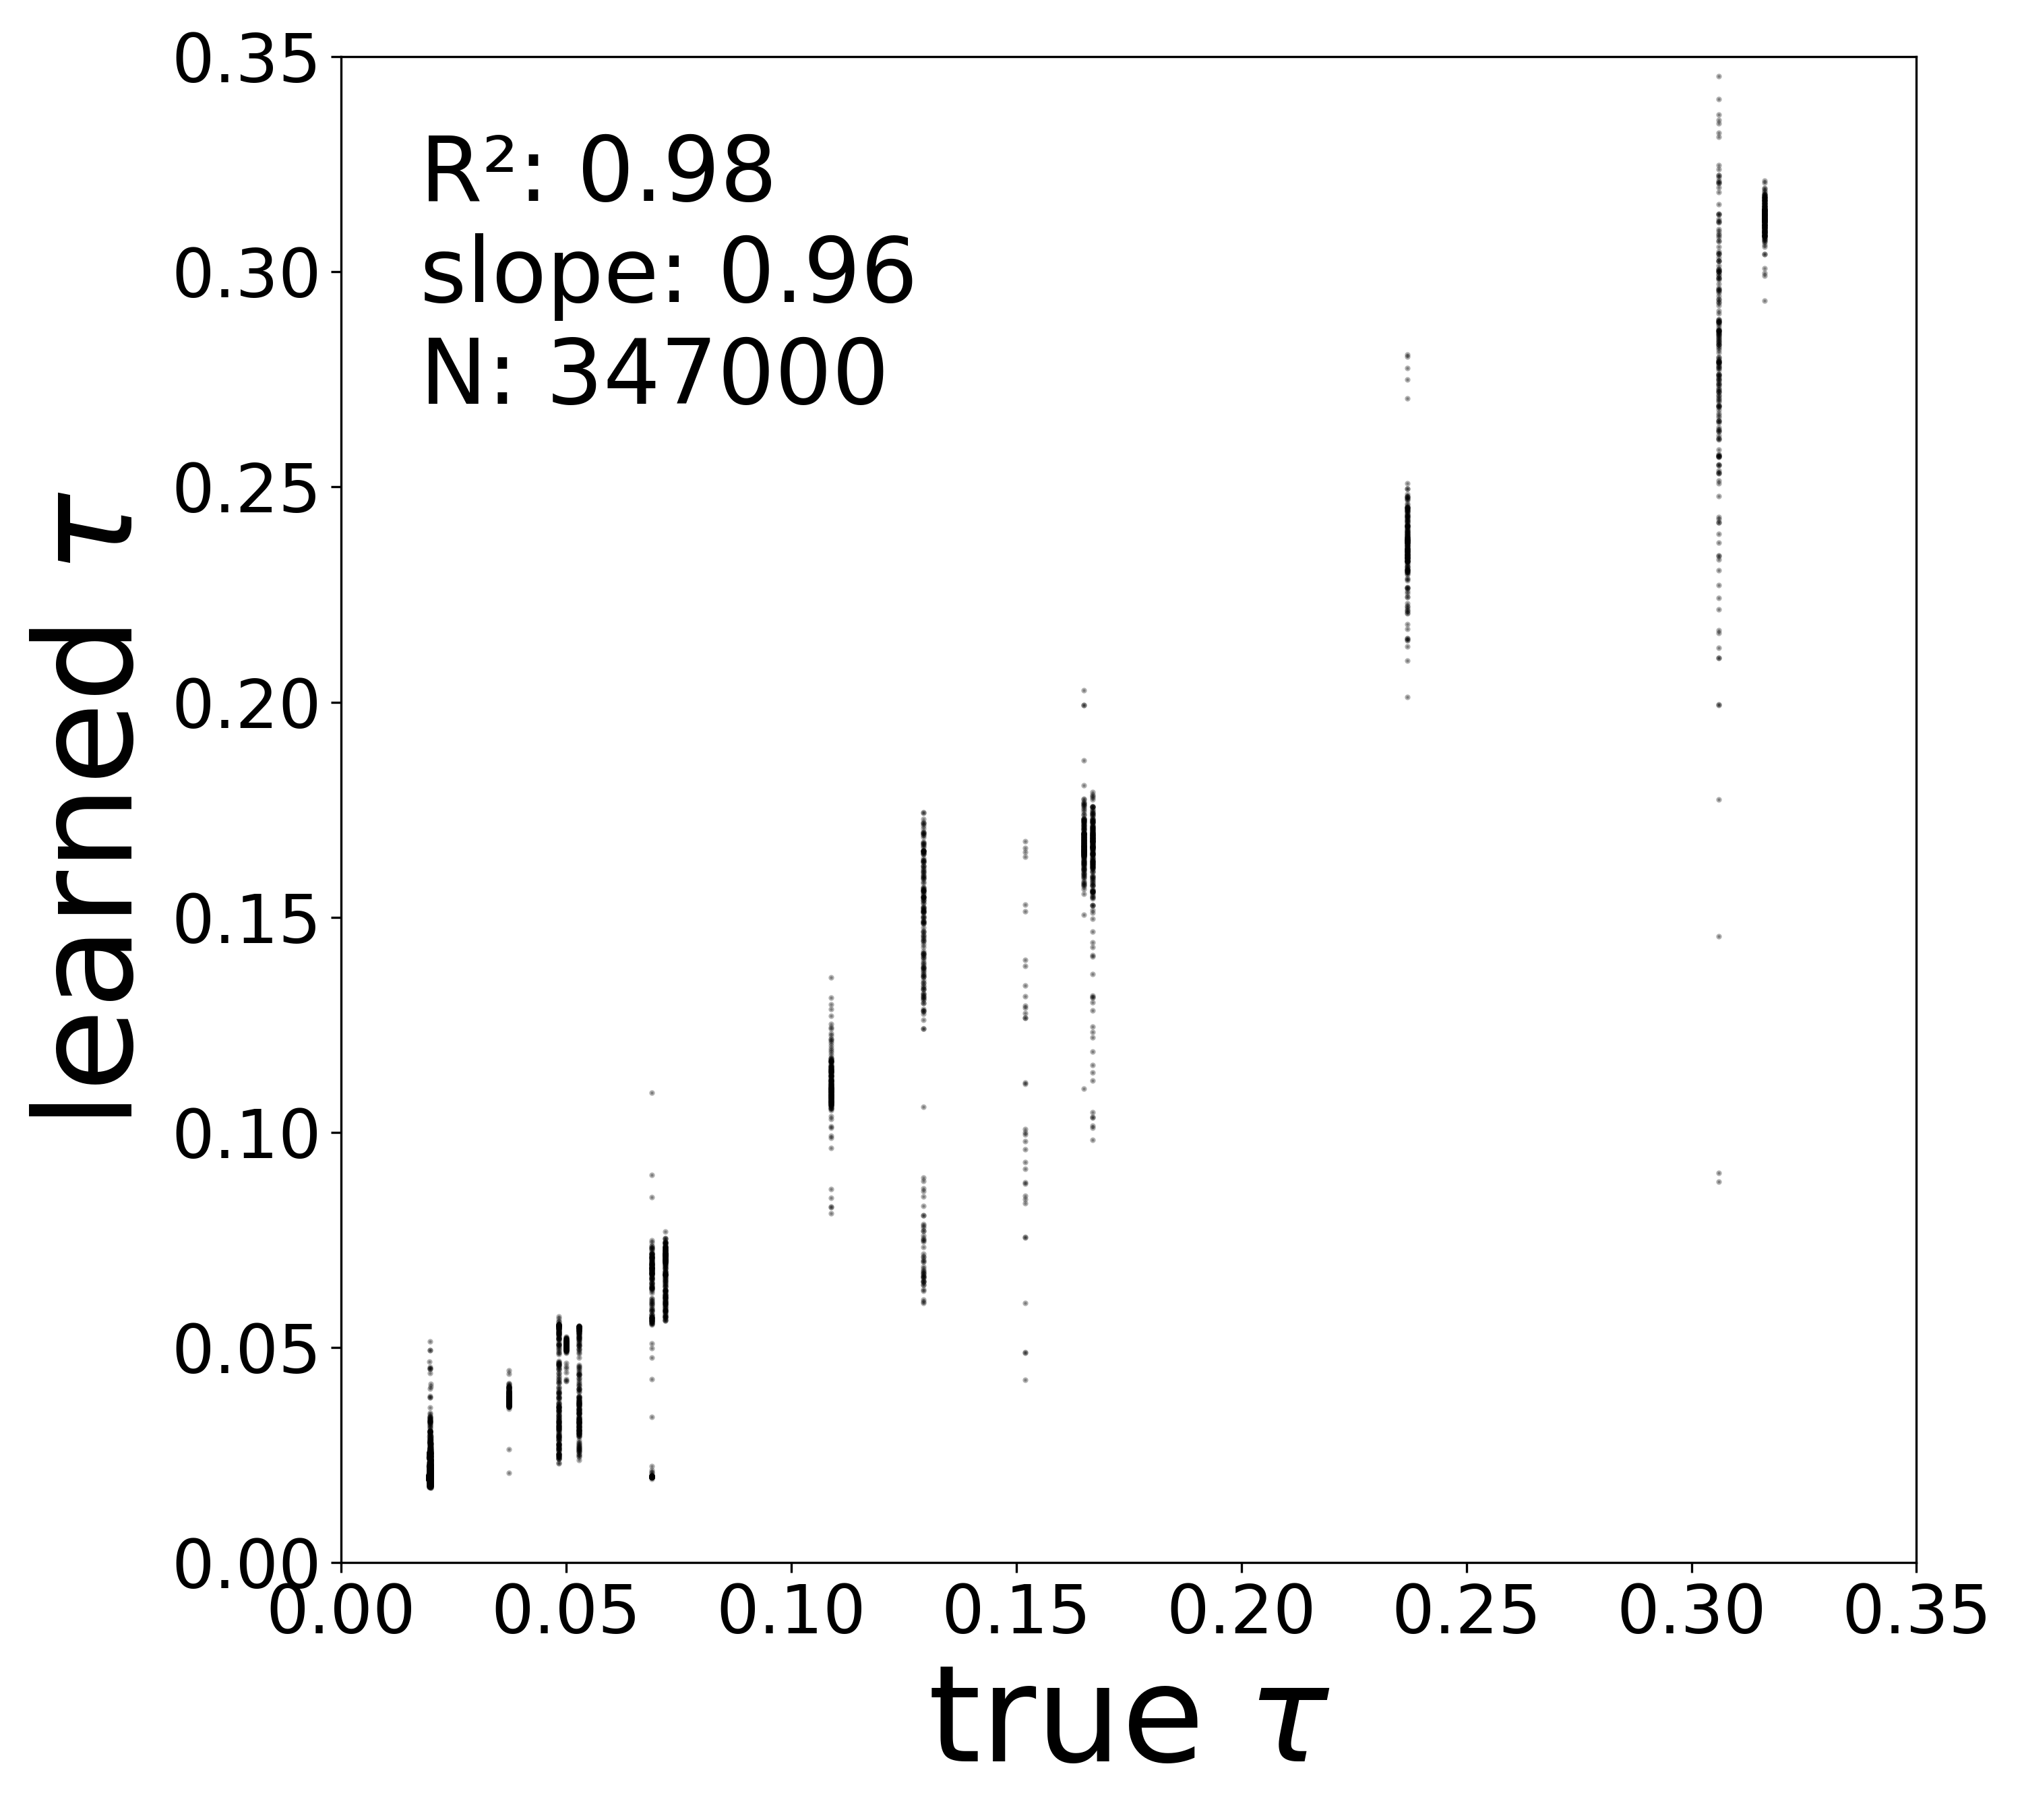
| \(\tau\) \(R^2\) | 0.9674 | 0.9799 | 0.9316 | 0.9787 |
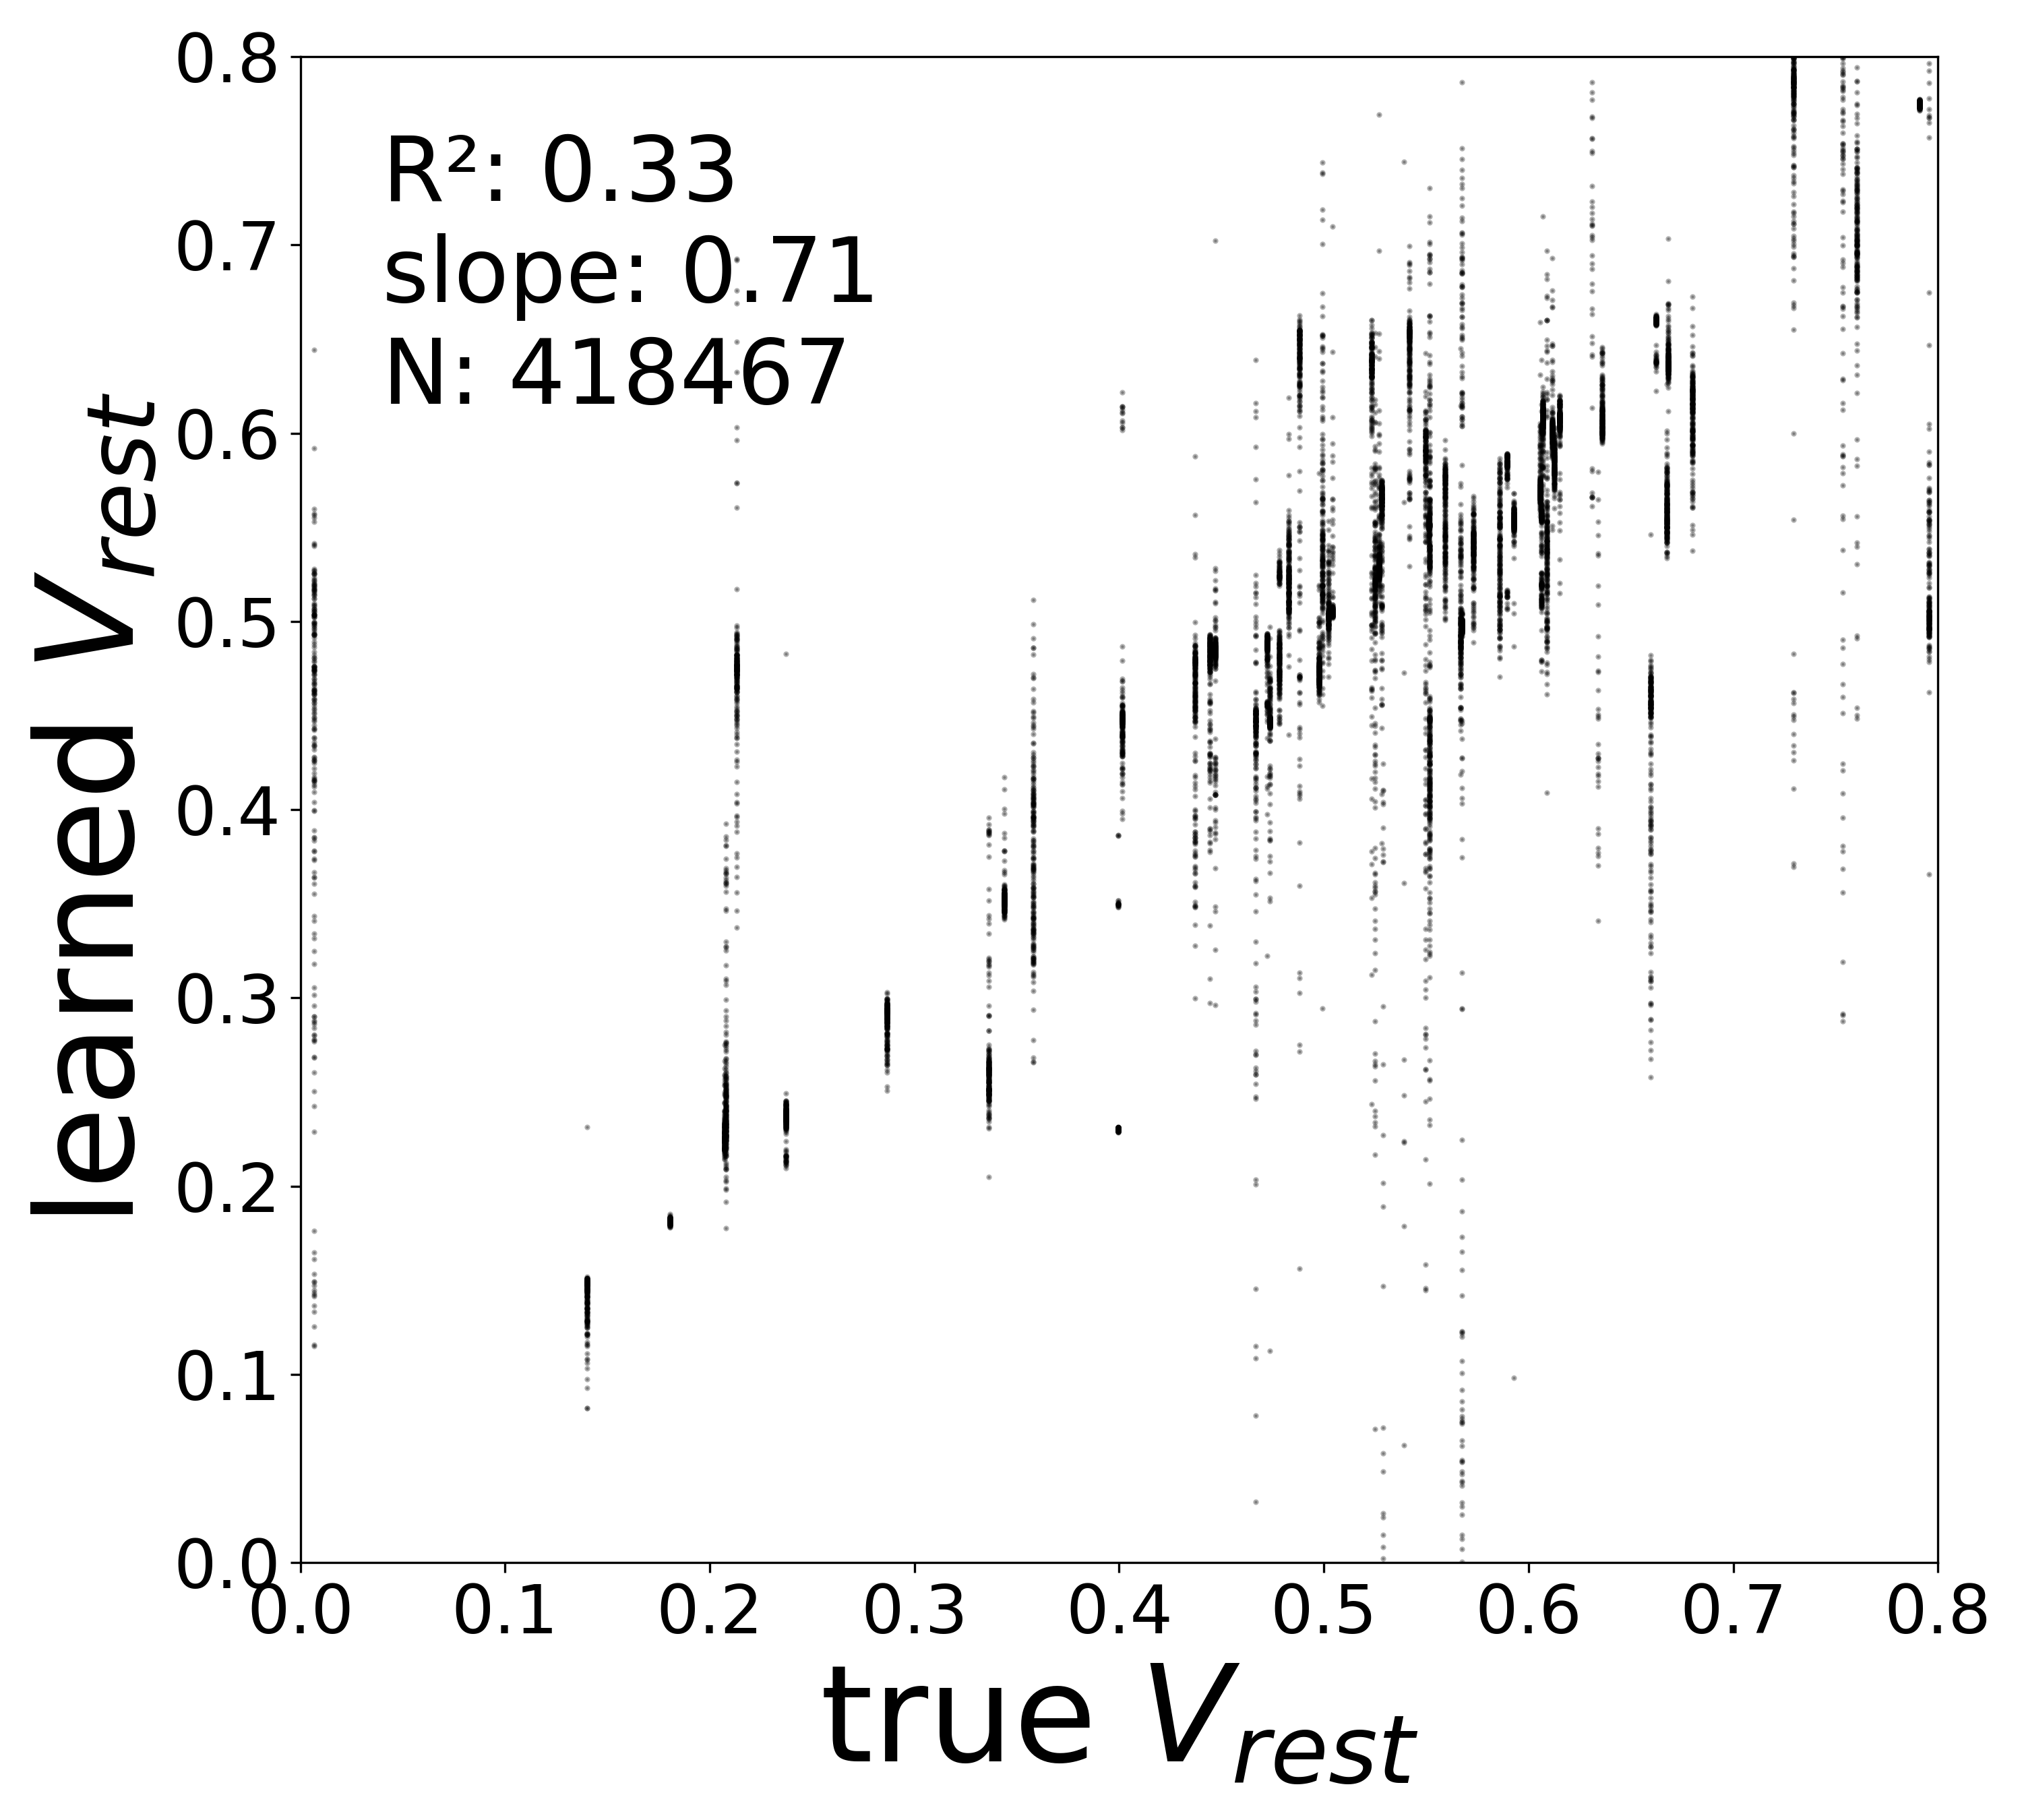
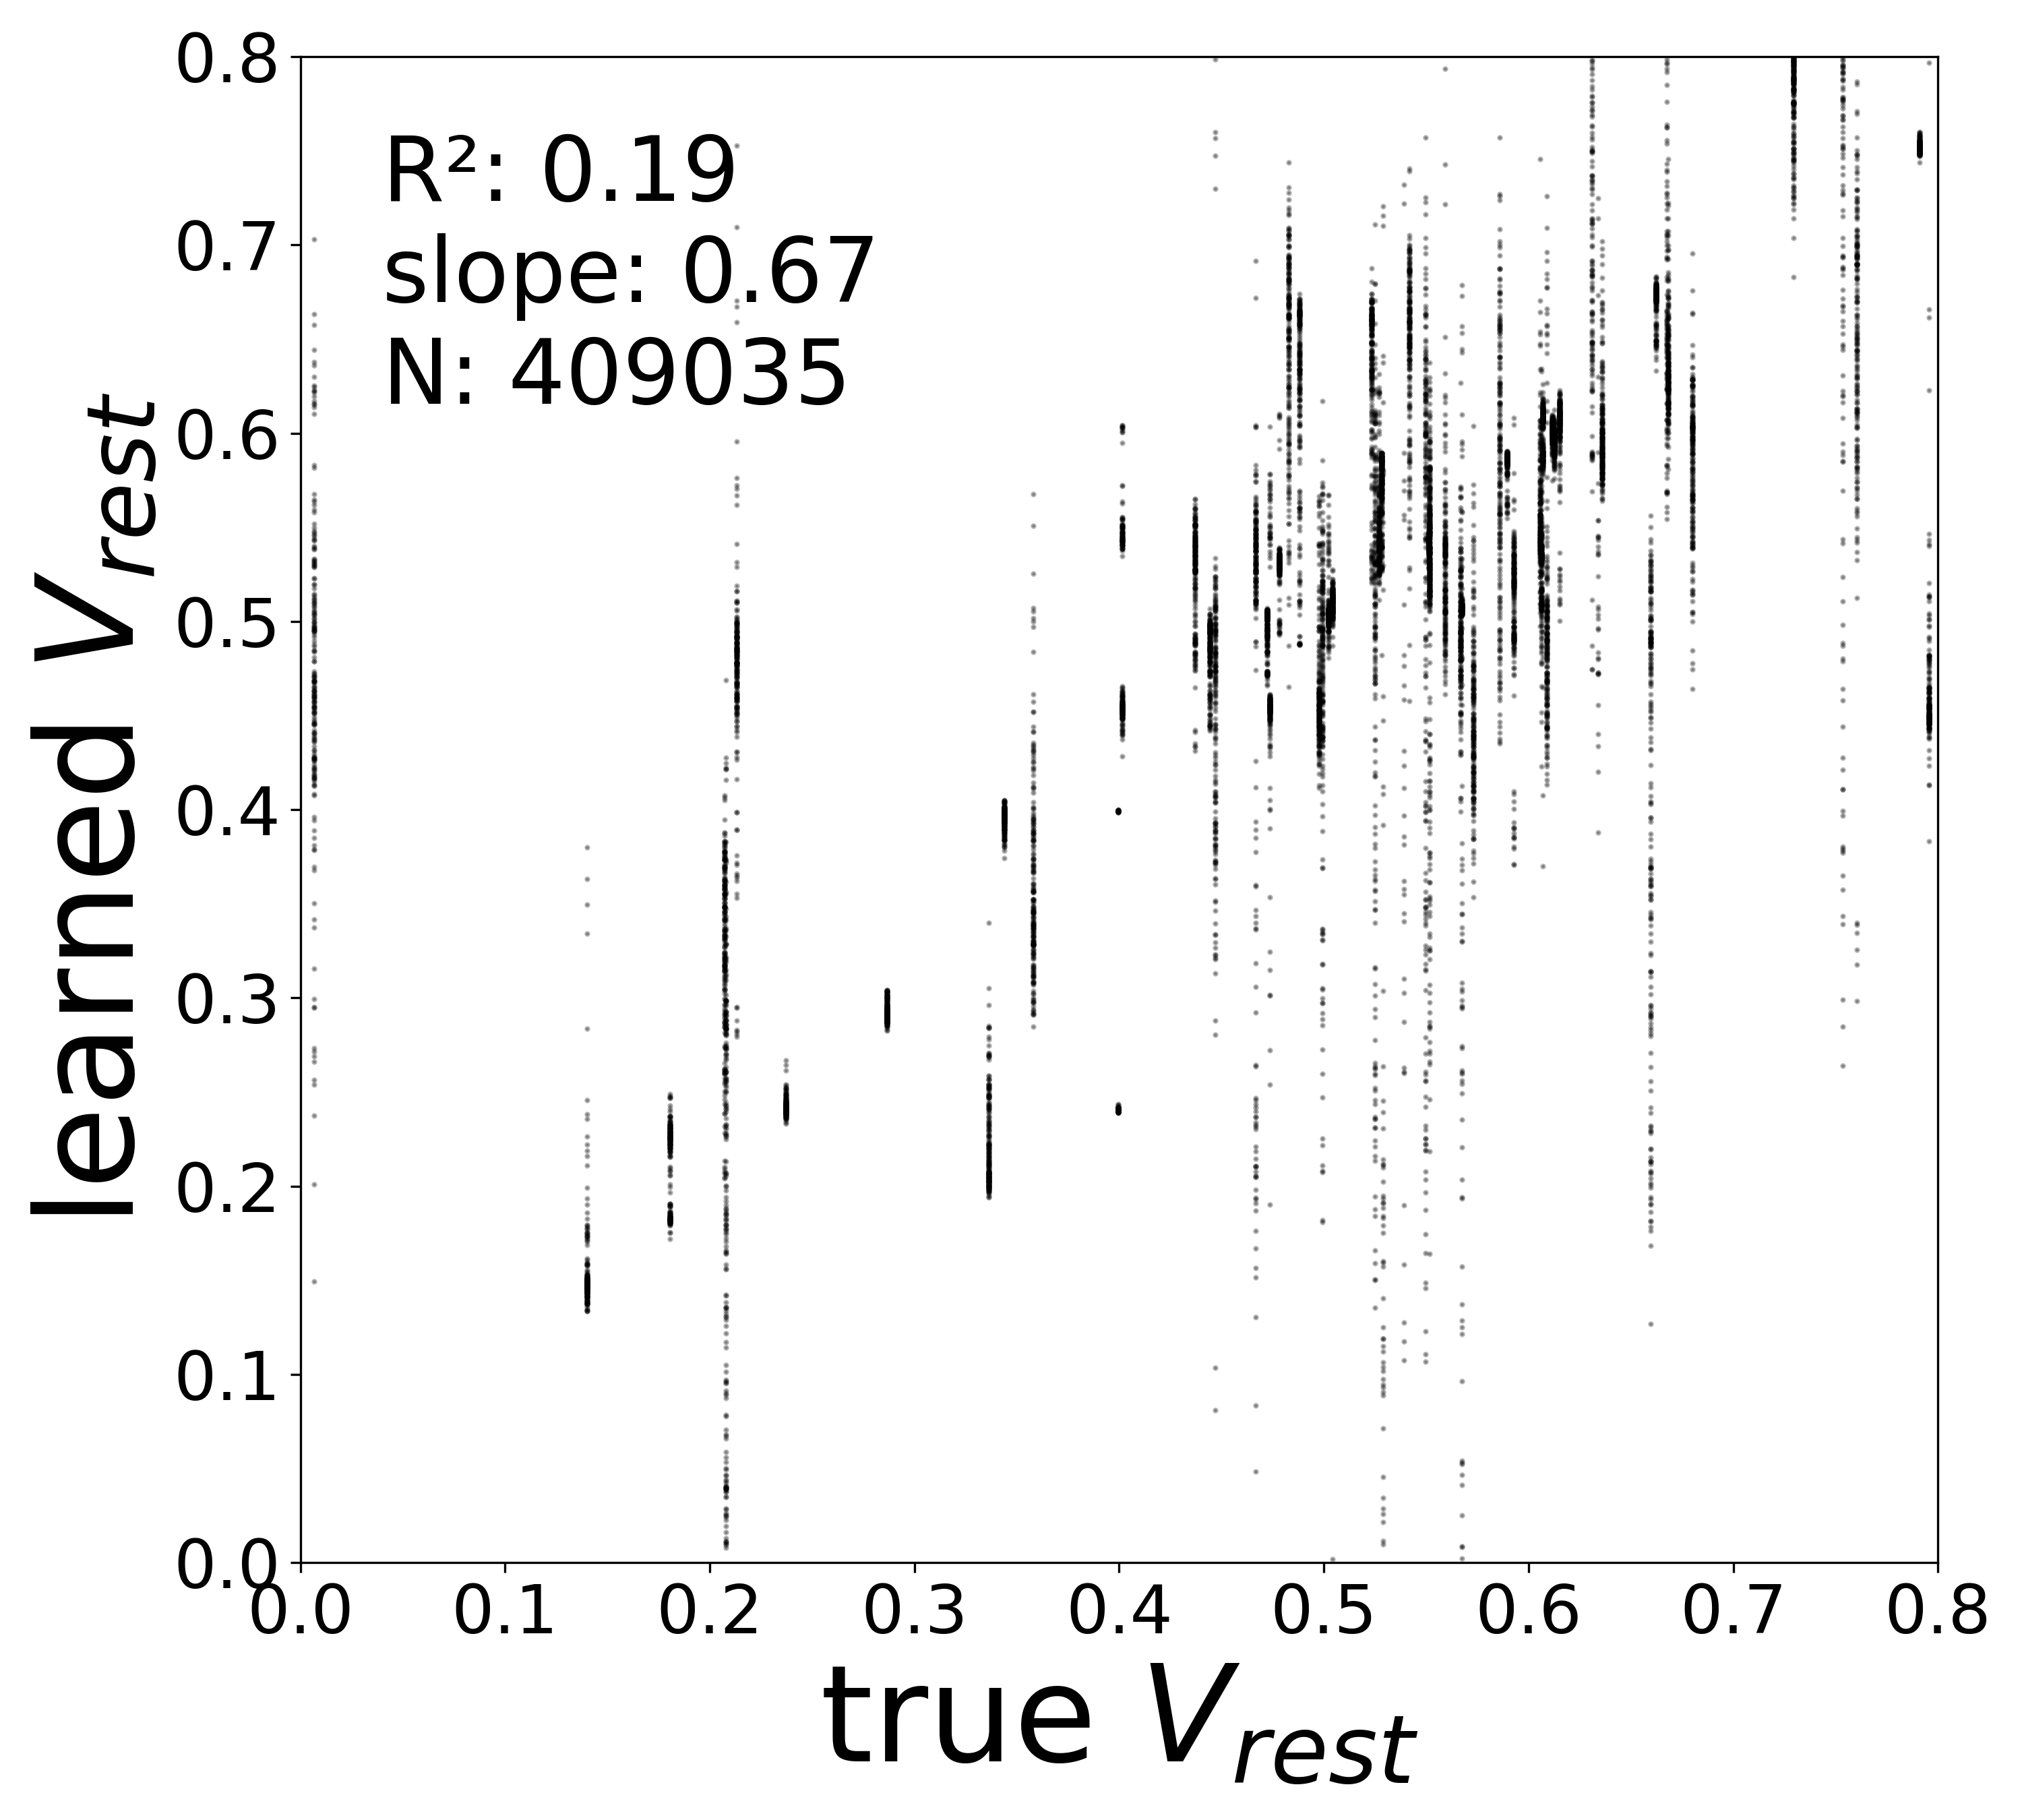
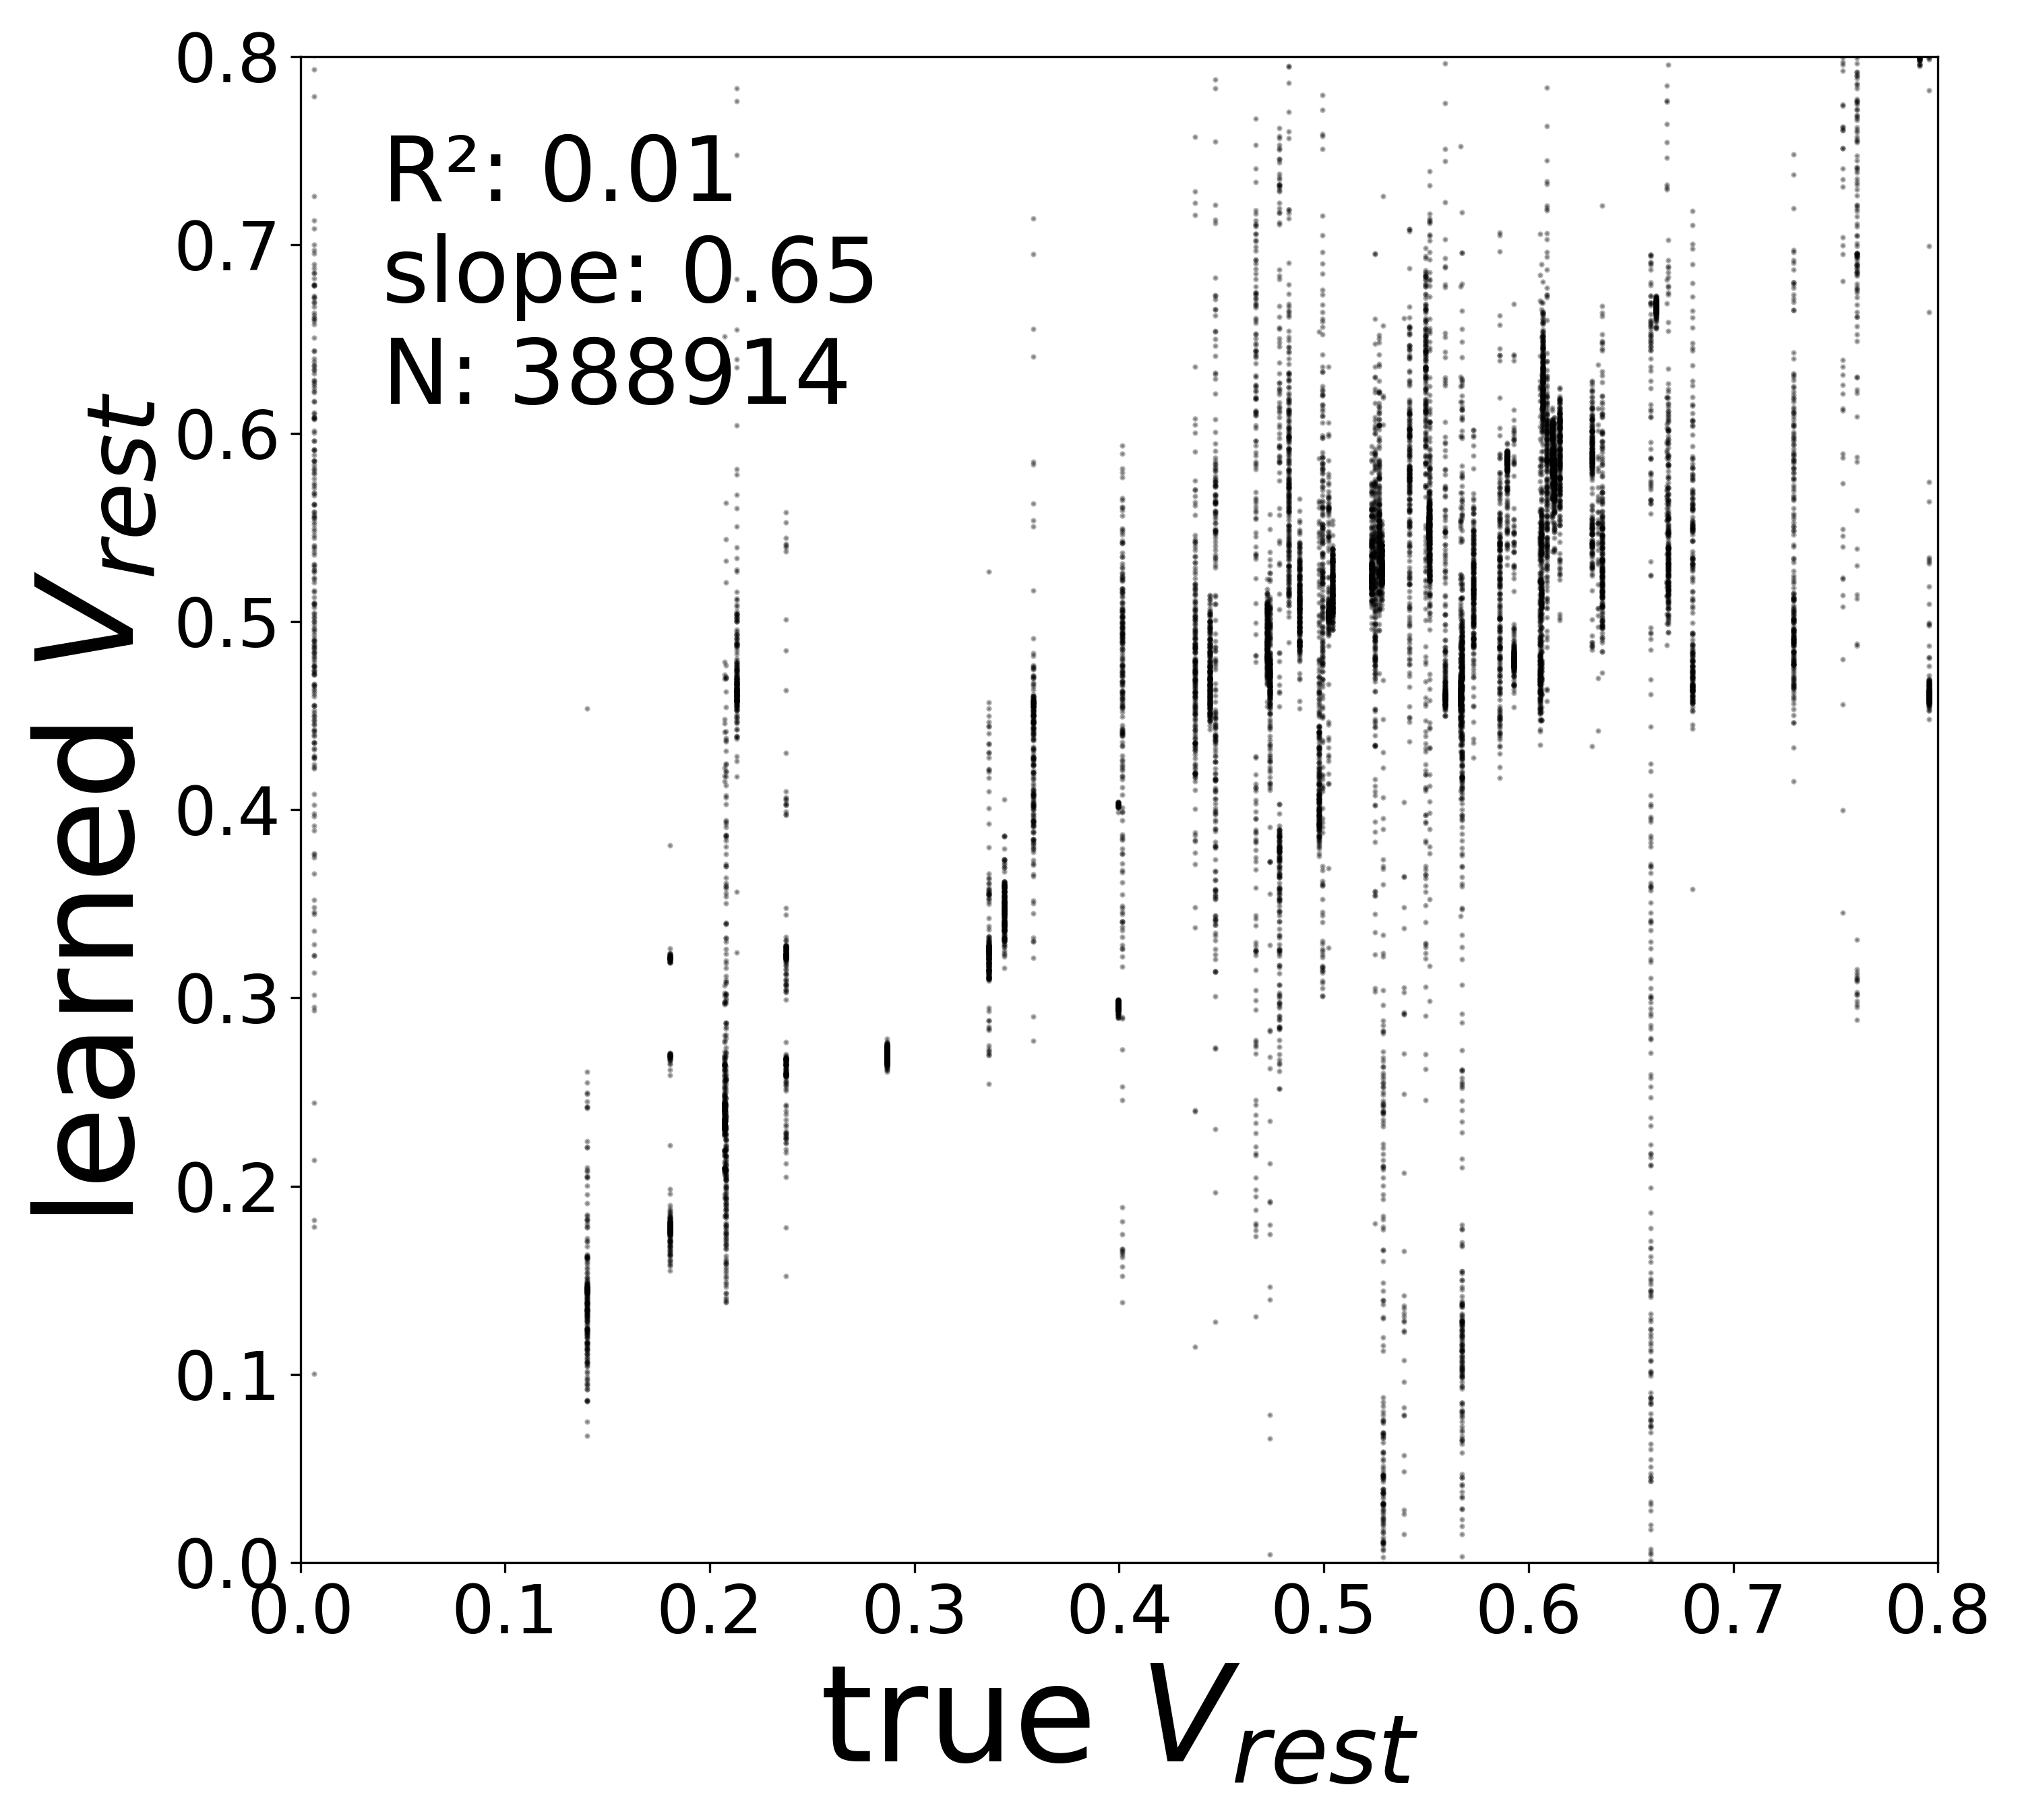
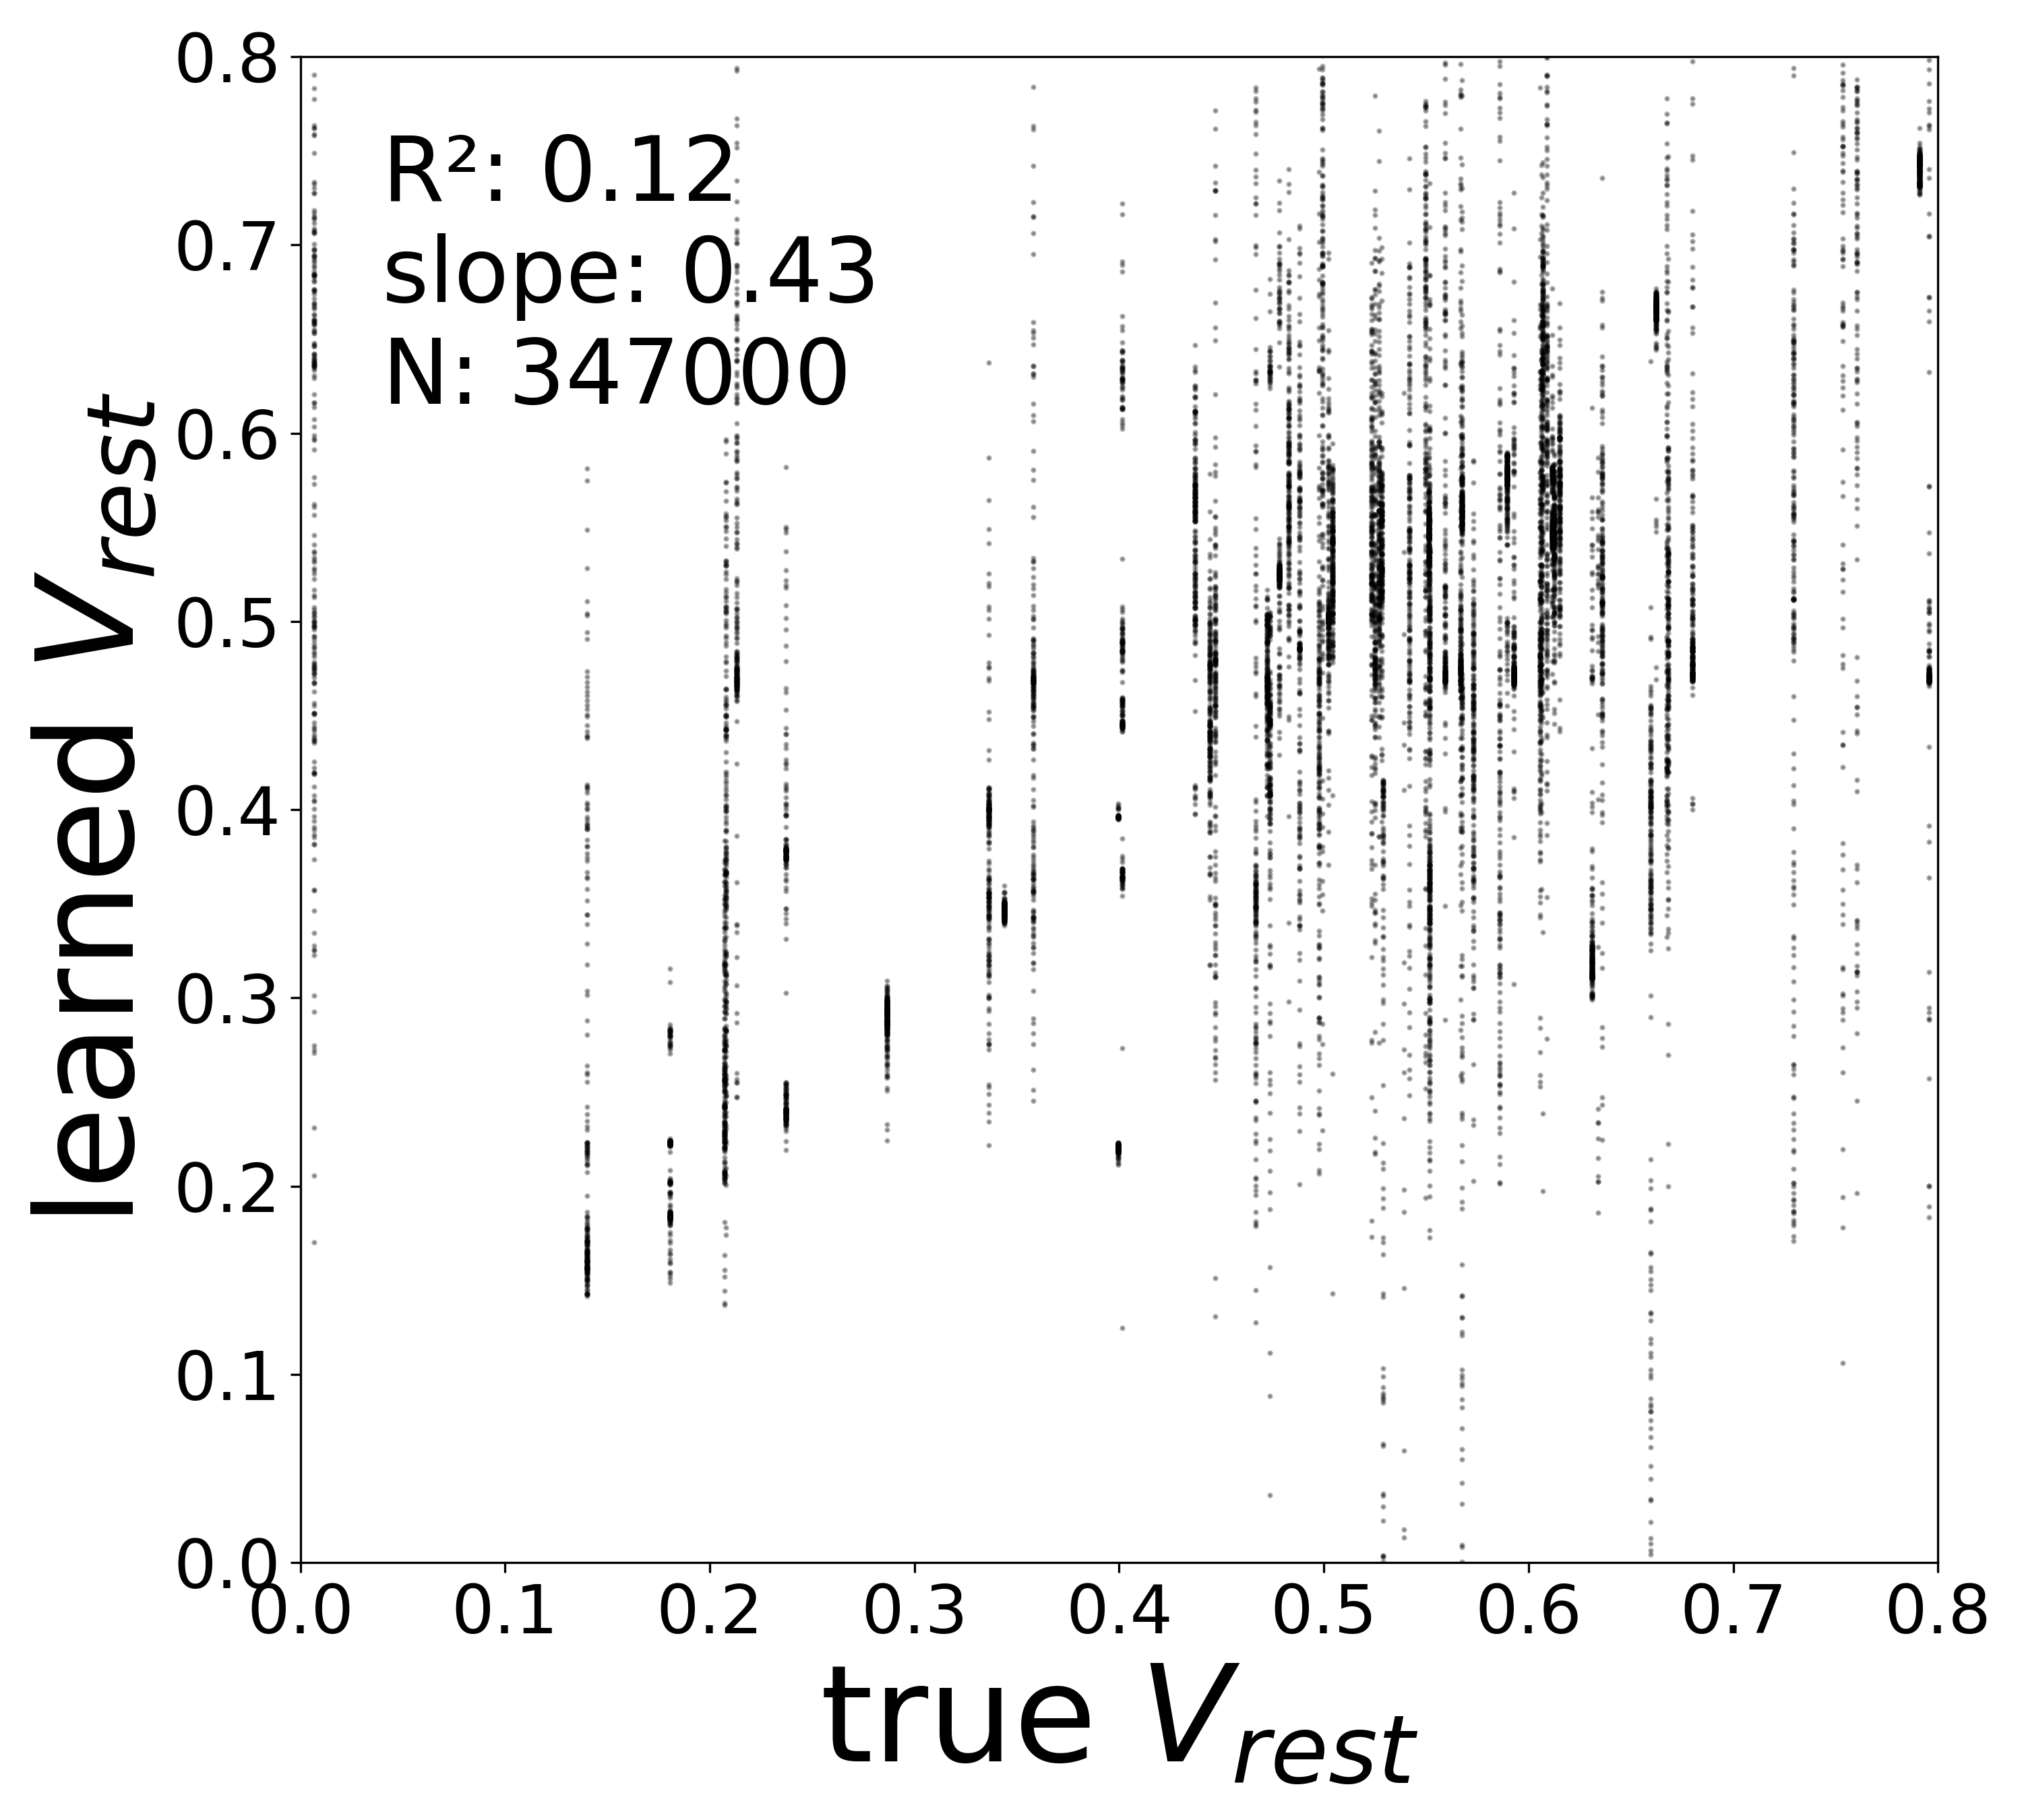
| \(V^{\text{rest}}\) \(R^2\) | 0.3289 | 0.1936 | 0.0079 | 0.1248 |
Robustness to Edge Removal
FlyVis
GNN
Edge Removal
Train the GNN on incomplete connectomes where 2%, 5%, 10%, and 20% of edges have been removed. Evaluate whether the model can still recover synaptic weights, biophysical parameters, and neuron-type identity despite missing connections.
Robustness to Edge Removal
In a real experimental setting, the connectome may contain false negatives: true synaptic connections that are missed during reconstruction. To test robustness to such incomplete adjacency matrices, we randomly removed a fraction of edges from the true connectome (434,112 edges) before training the GNN. The model must recover the circuit parameters using only the remaining connections.
We tested four levels of edge removal:
| Config | Removed edges | Remaining edges | Fraction removed |
|---|---|---|---|
flyvis_noise_005_removed_pc_02 |
8,682 | 425,430 | 2% |
flyvis_noise_005_removed_pc_05 |
21,706 | 412,406 | 5% |
flyvis_noise_005_removed_pc_10 |
43,411 | 390,701 | 10% |
flyvis_noise_005_removed_pc_20 |
86,822 | 347,290 | 20% |
Noise Level
Recall that the simulated dynamics include an intrinsic noise term \(\sigma\,\xi_i(t)\) where \(\xi_i(t) \sim \mathcal{N}(0,1)\) (Notebook 00). All edge-removal experiments presented here use a fixed noise level of \(\sigma = 0.05\) (low noise). To change the noise level, edit the noise_model_level field in the respective config files:
config/fly/flyvis_noise_005_removed_pc_02.yamlconfig/fly/flyvis_noise_005_removed_pc_05.yamlconfig/fly/flyvis_noise_005_removed_pc_10.yamlconfig/fly/flyvis_noise_005_removed_pc_20.yaml
Results
Each config extends the base flyvis_noise_005 setup with a different fraction of edges randomly removed from the adjacency matrix. Edges are removed uniformly at random per column (consistent across pre-synaptic neurons). The GNN architecture and training hyperparameters are otherwise identical across conditions.
The GNN tolerates significant edge removal: even with 20% of connections missing, it recovers the remaining synaptic weights and biophysical parameters with high fidelity. This suggests the model exploits redundancy in the network dynamics to compensate for incomplete connectivity information.
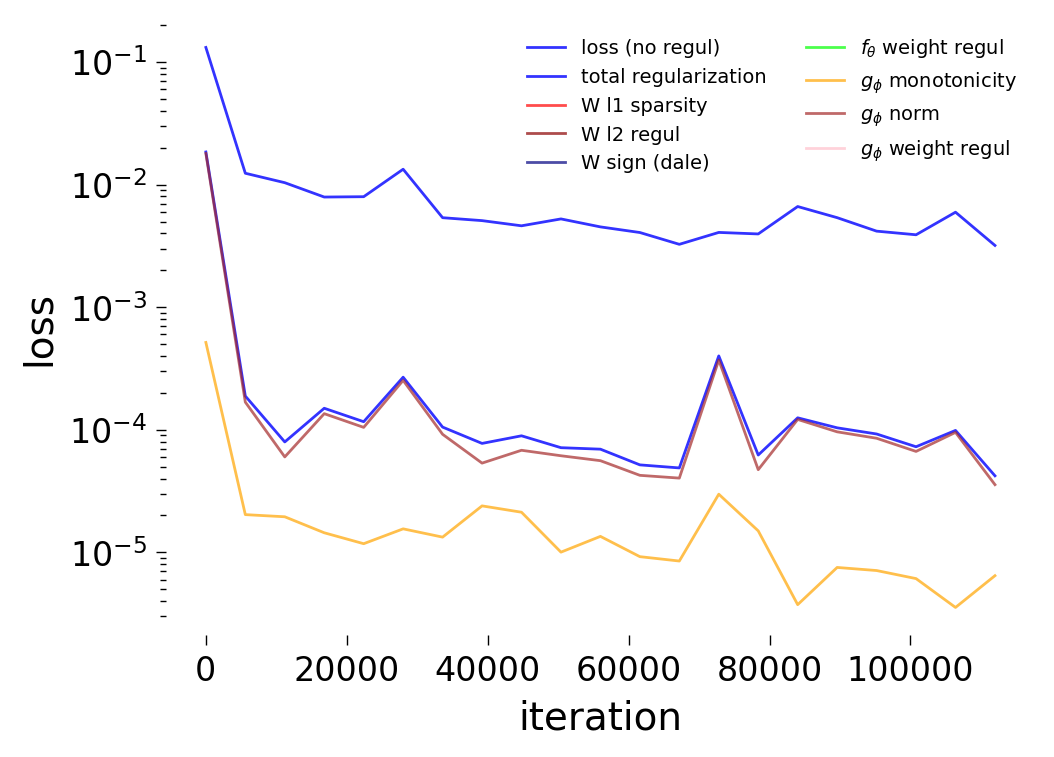
Loss Curves
2% edges removed (8,682 removed / 425,430 remaining)
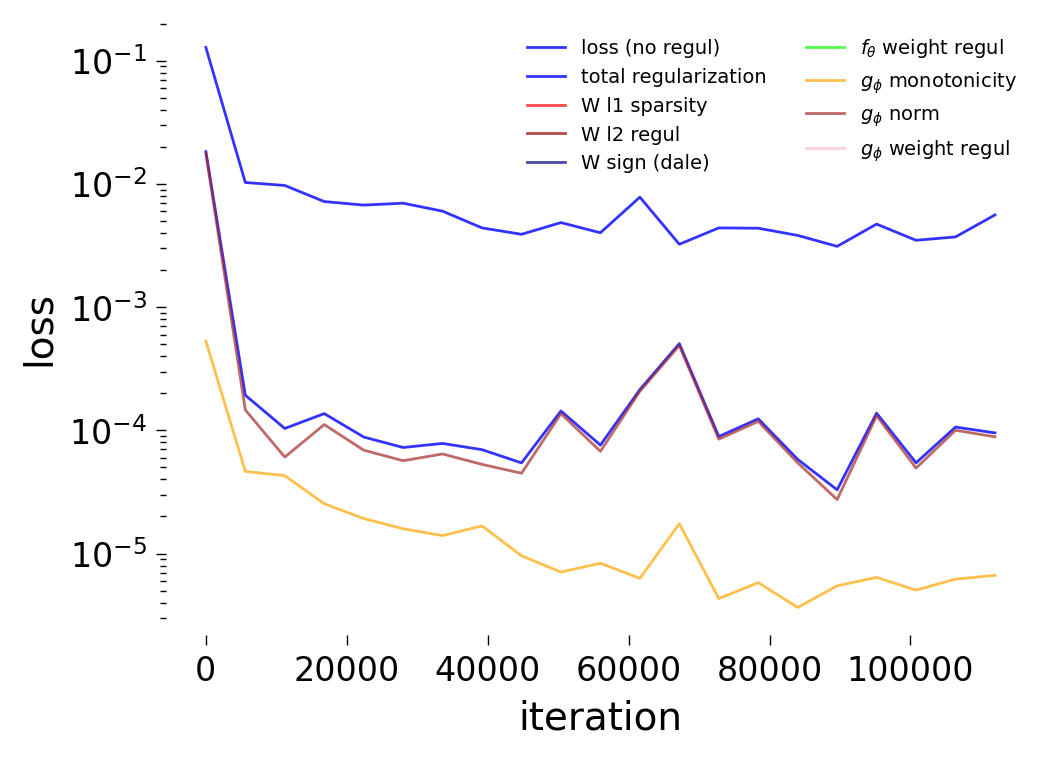
5% edges removed (21,706 removed / 412,406 remaining)
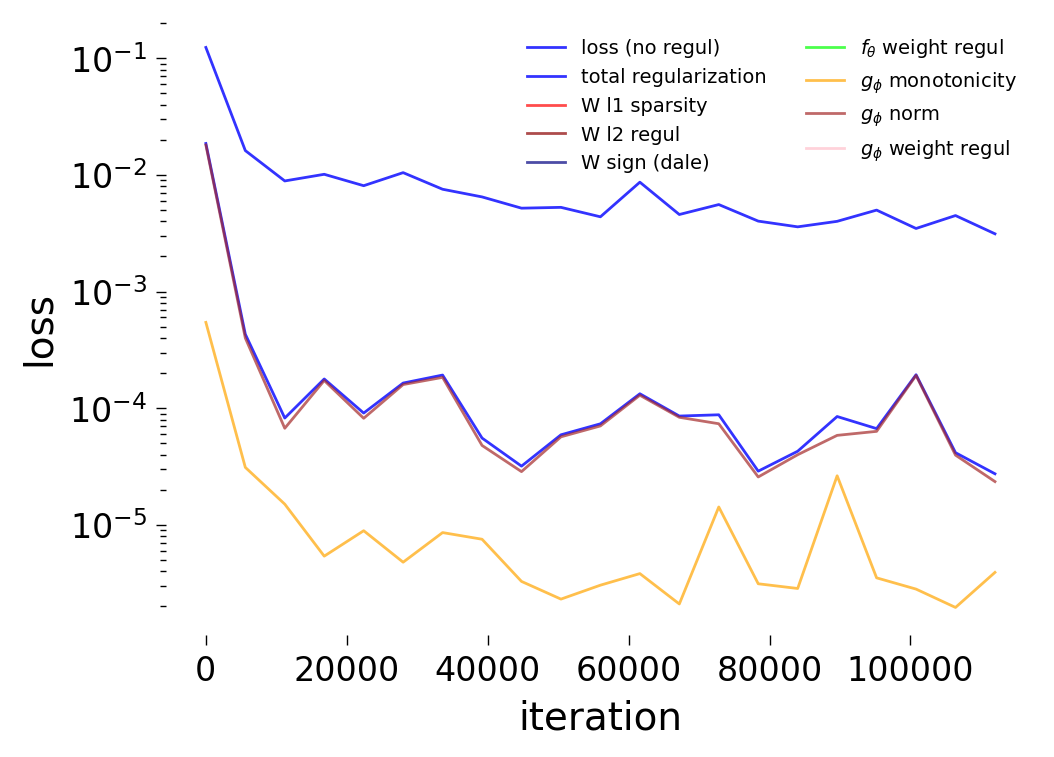
10% edges removed (43,411 removed / 390,701 remaining)
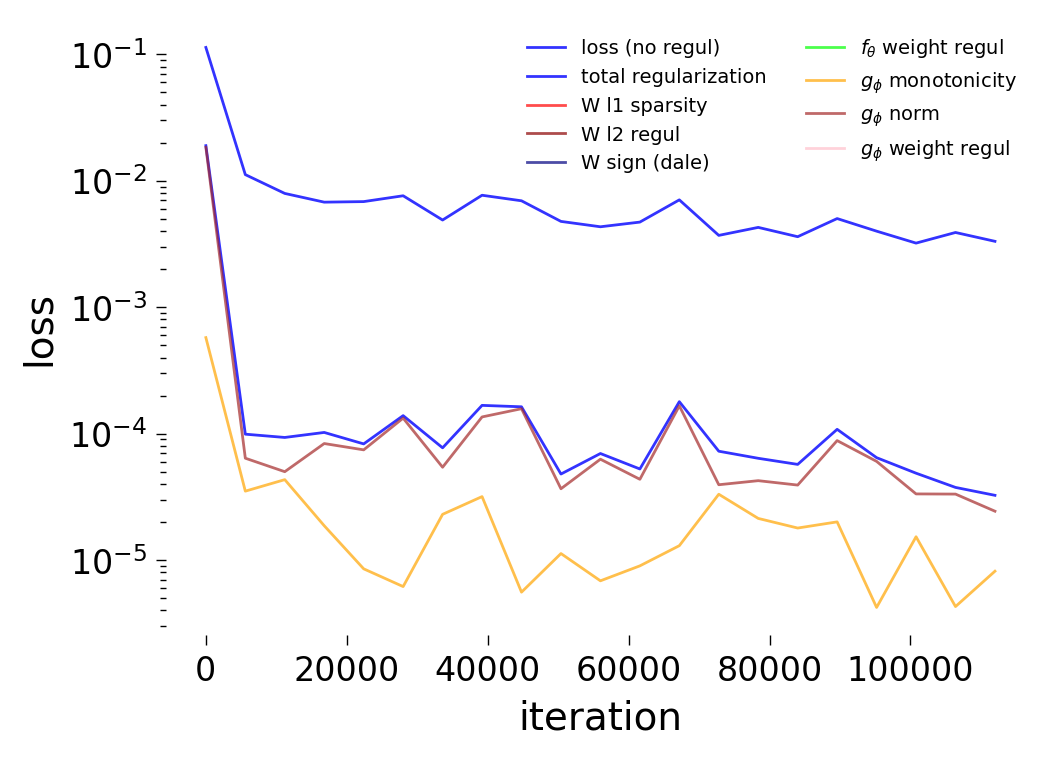
20% edges removed (86,822 removed / 347,290 remaining)
Testing
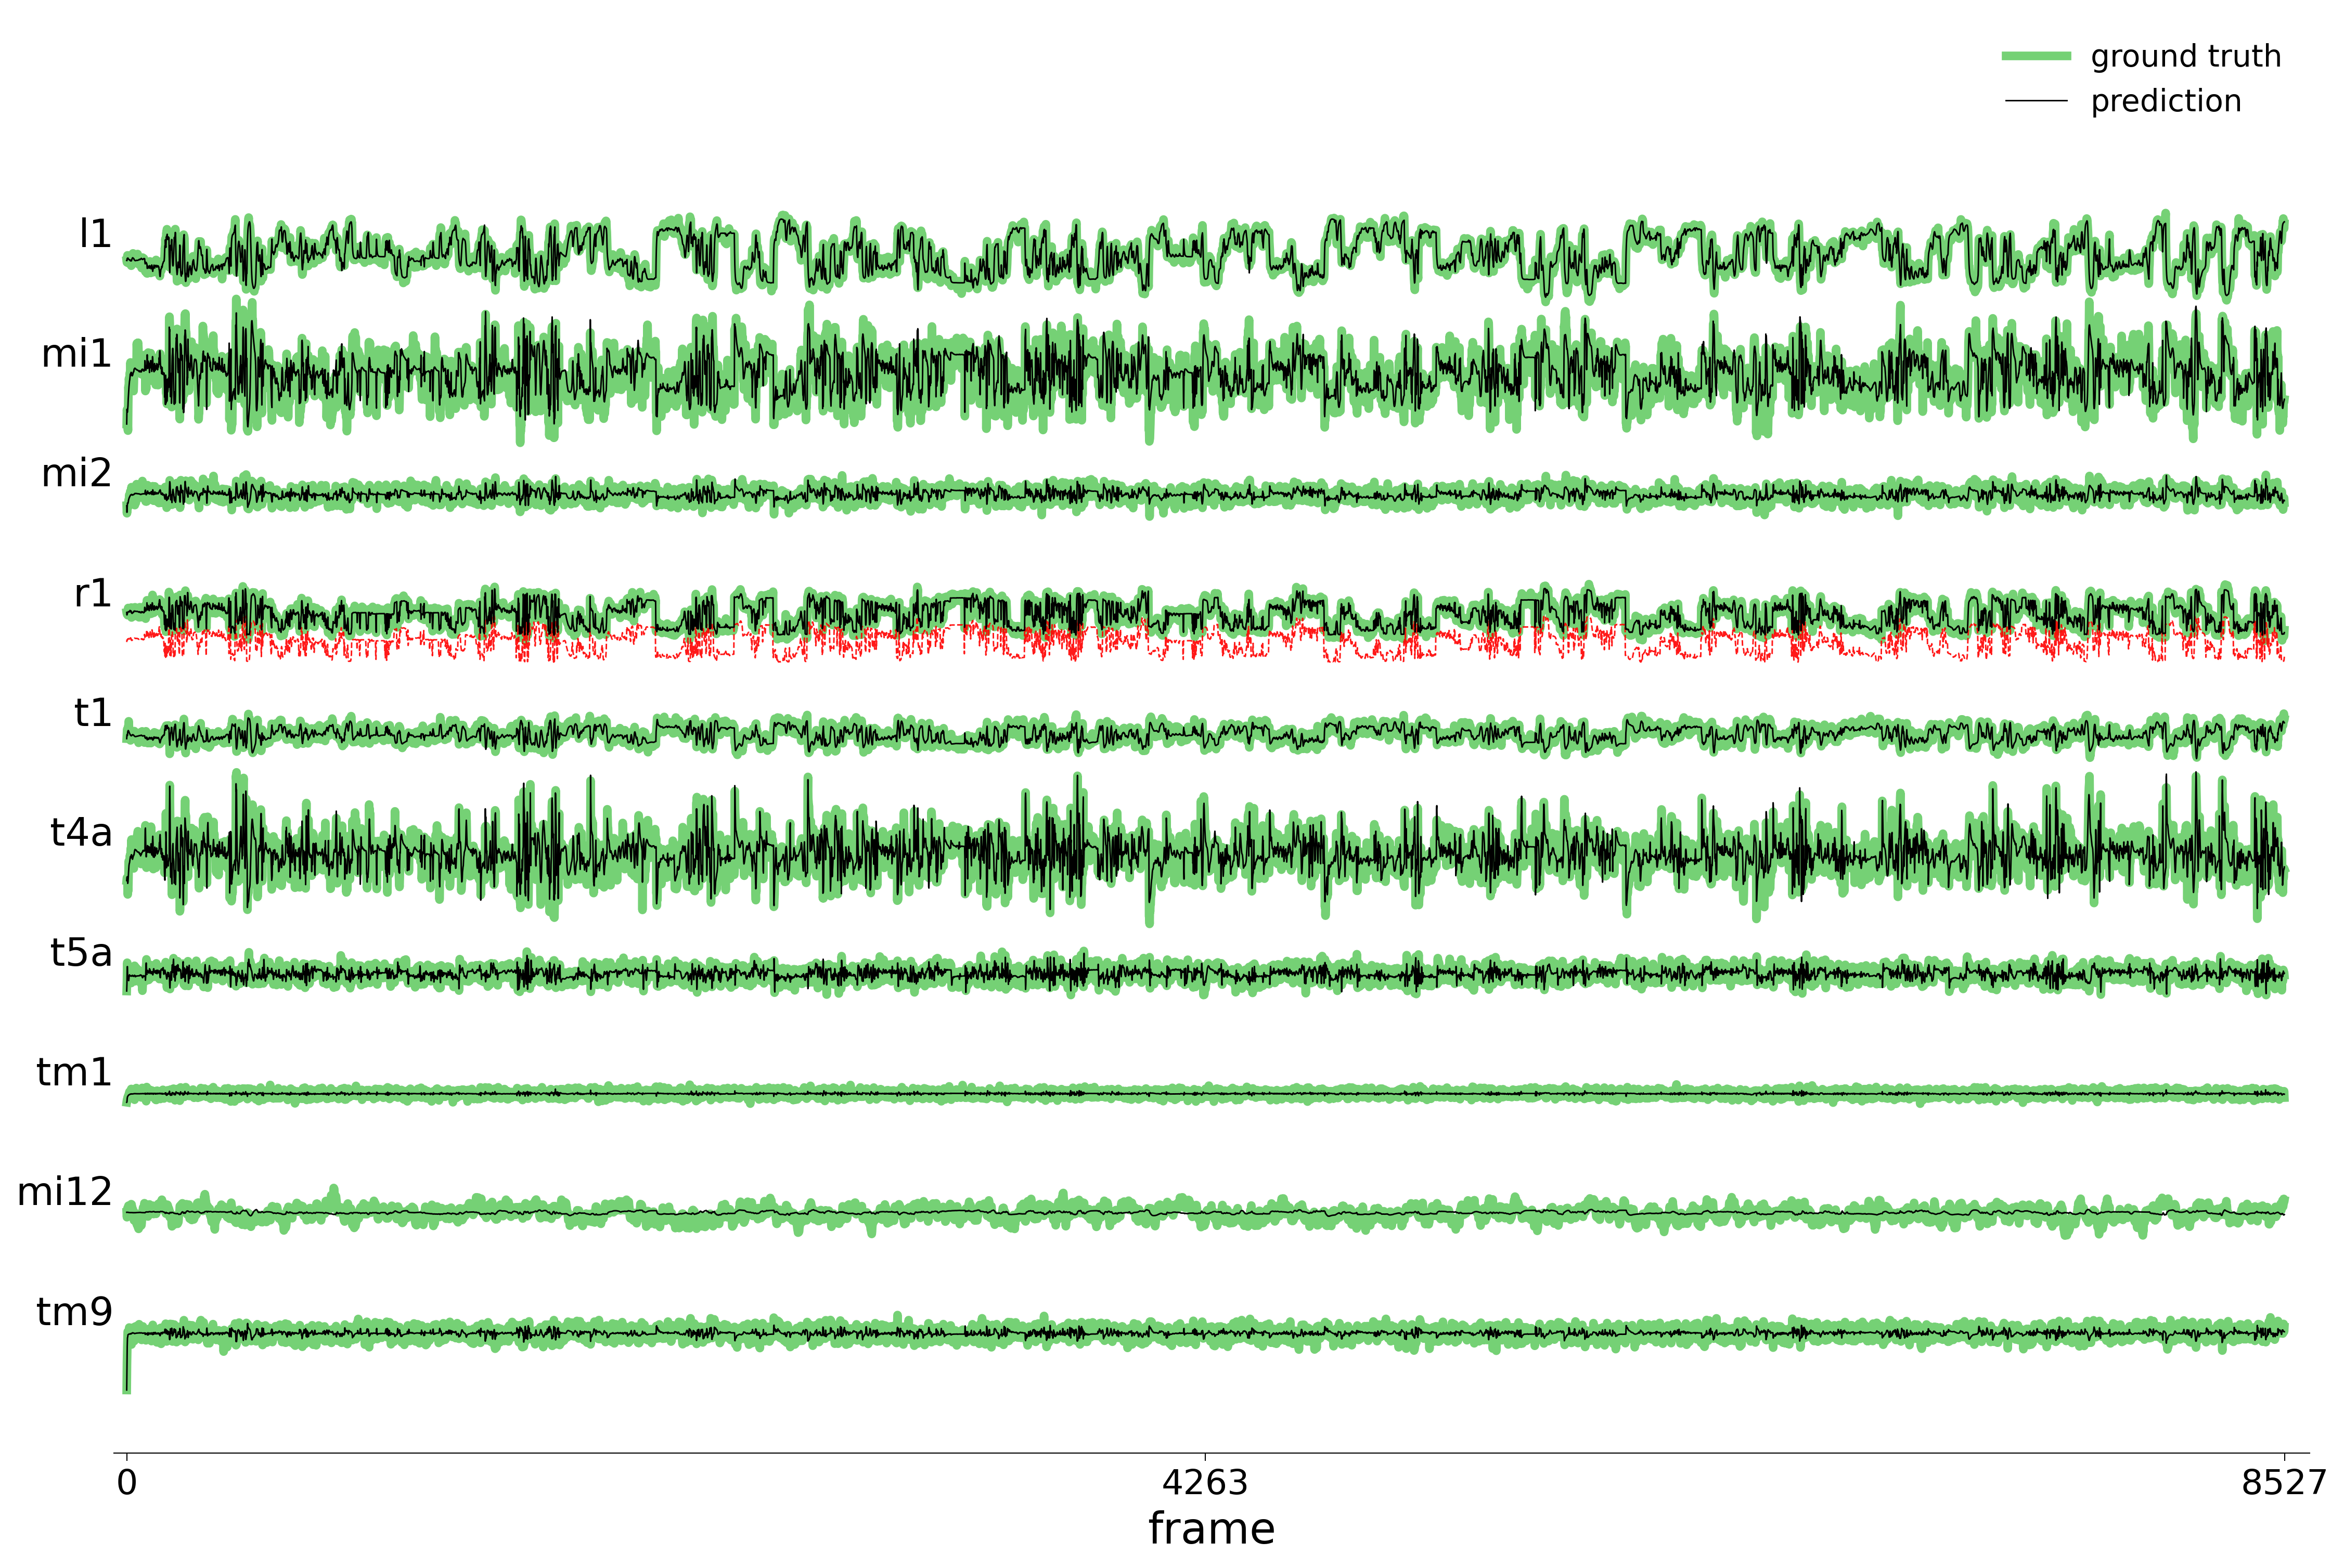
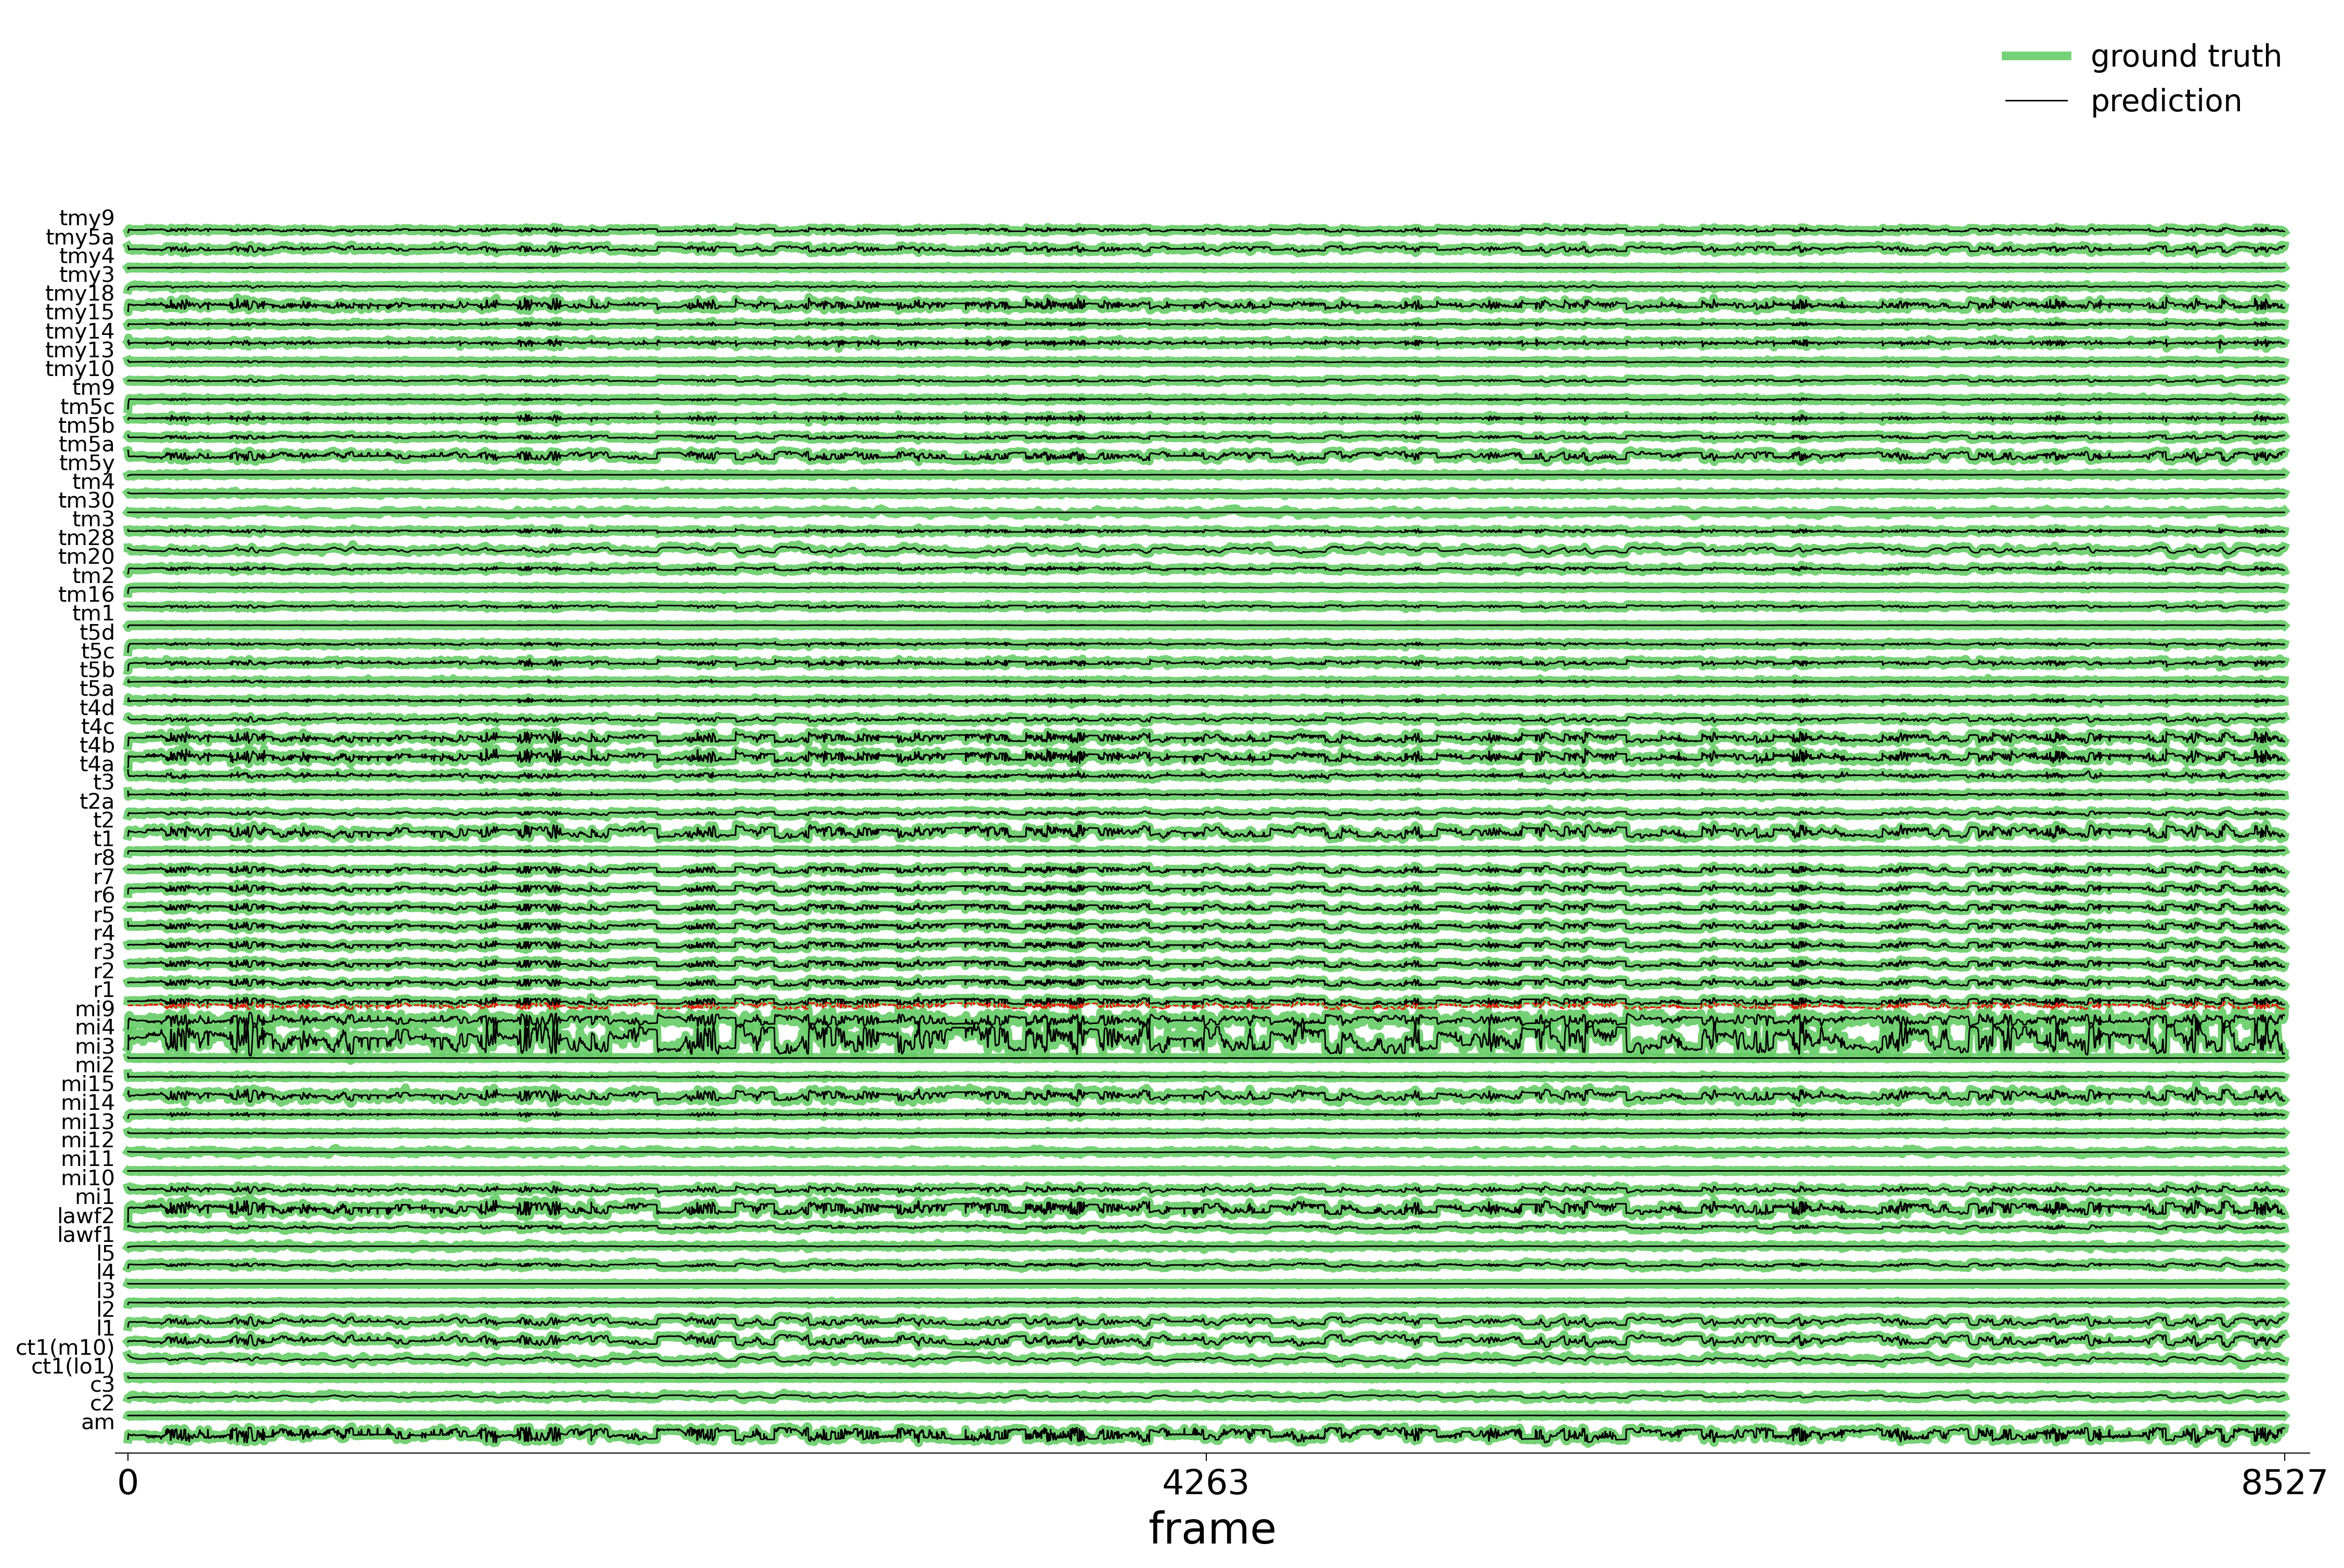
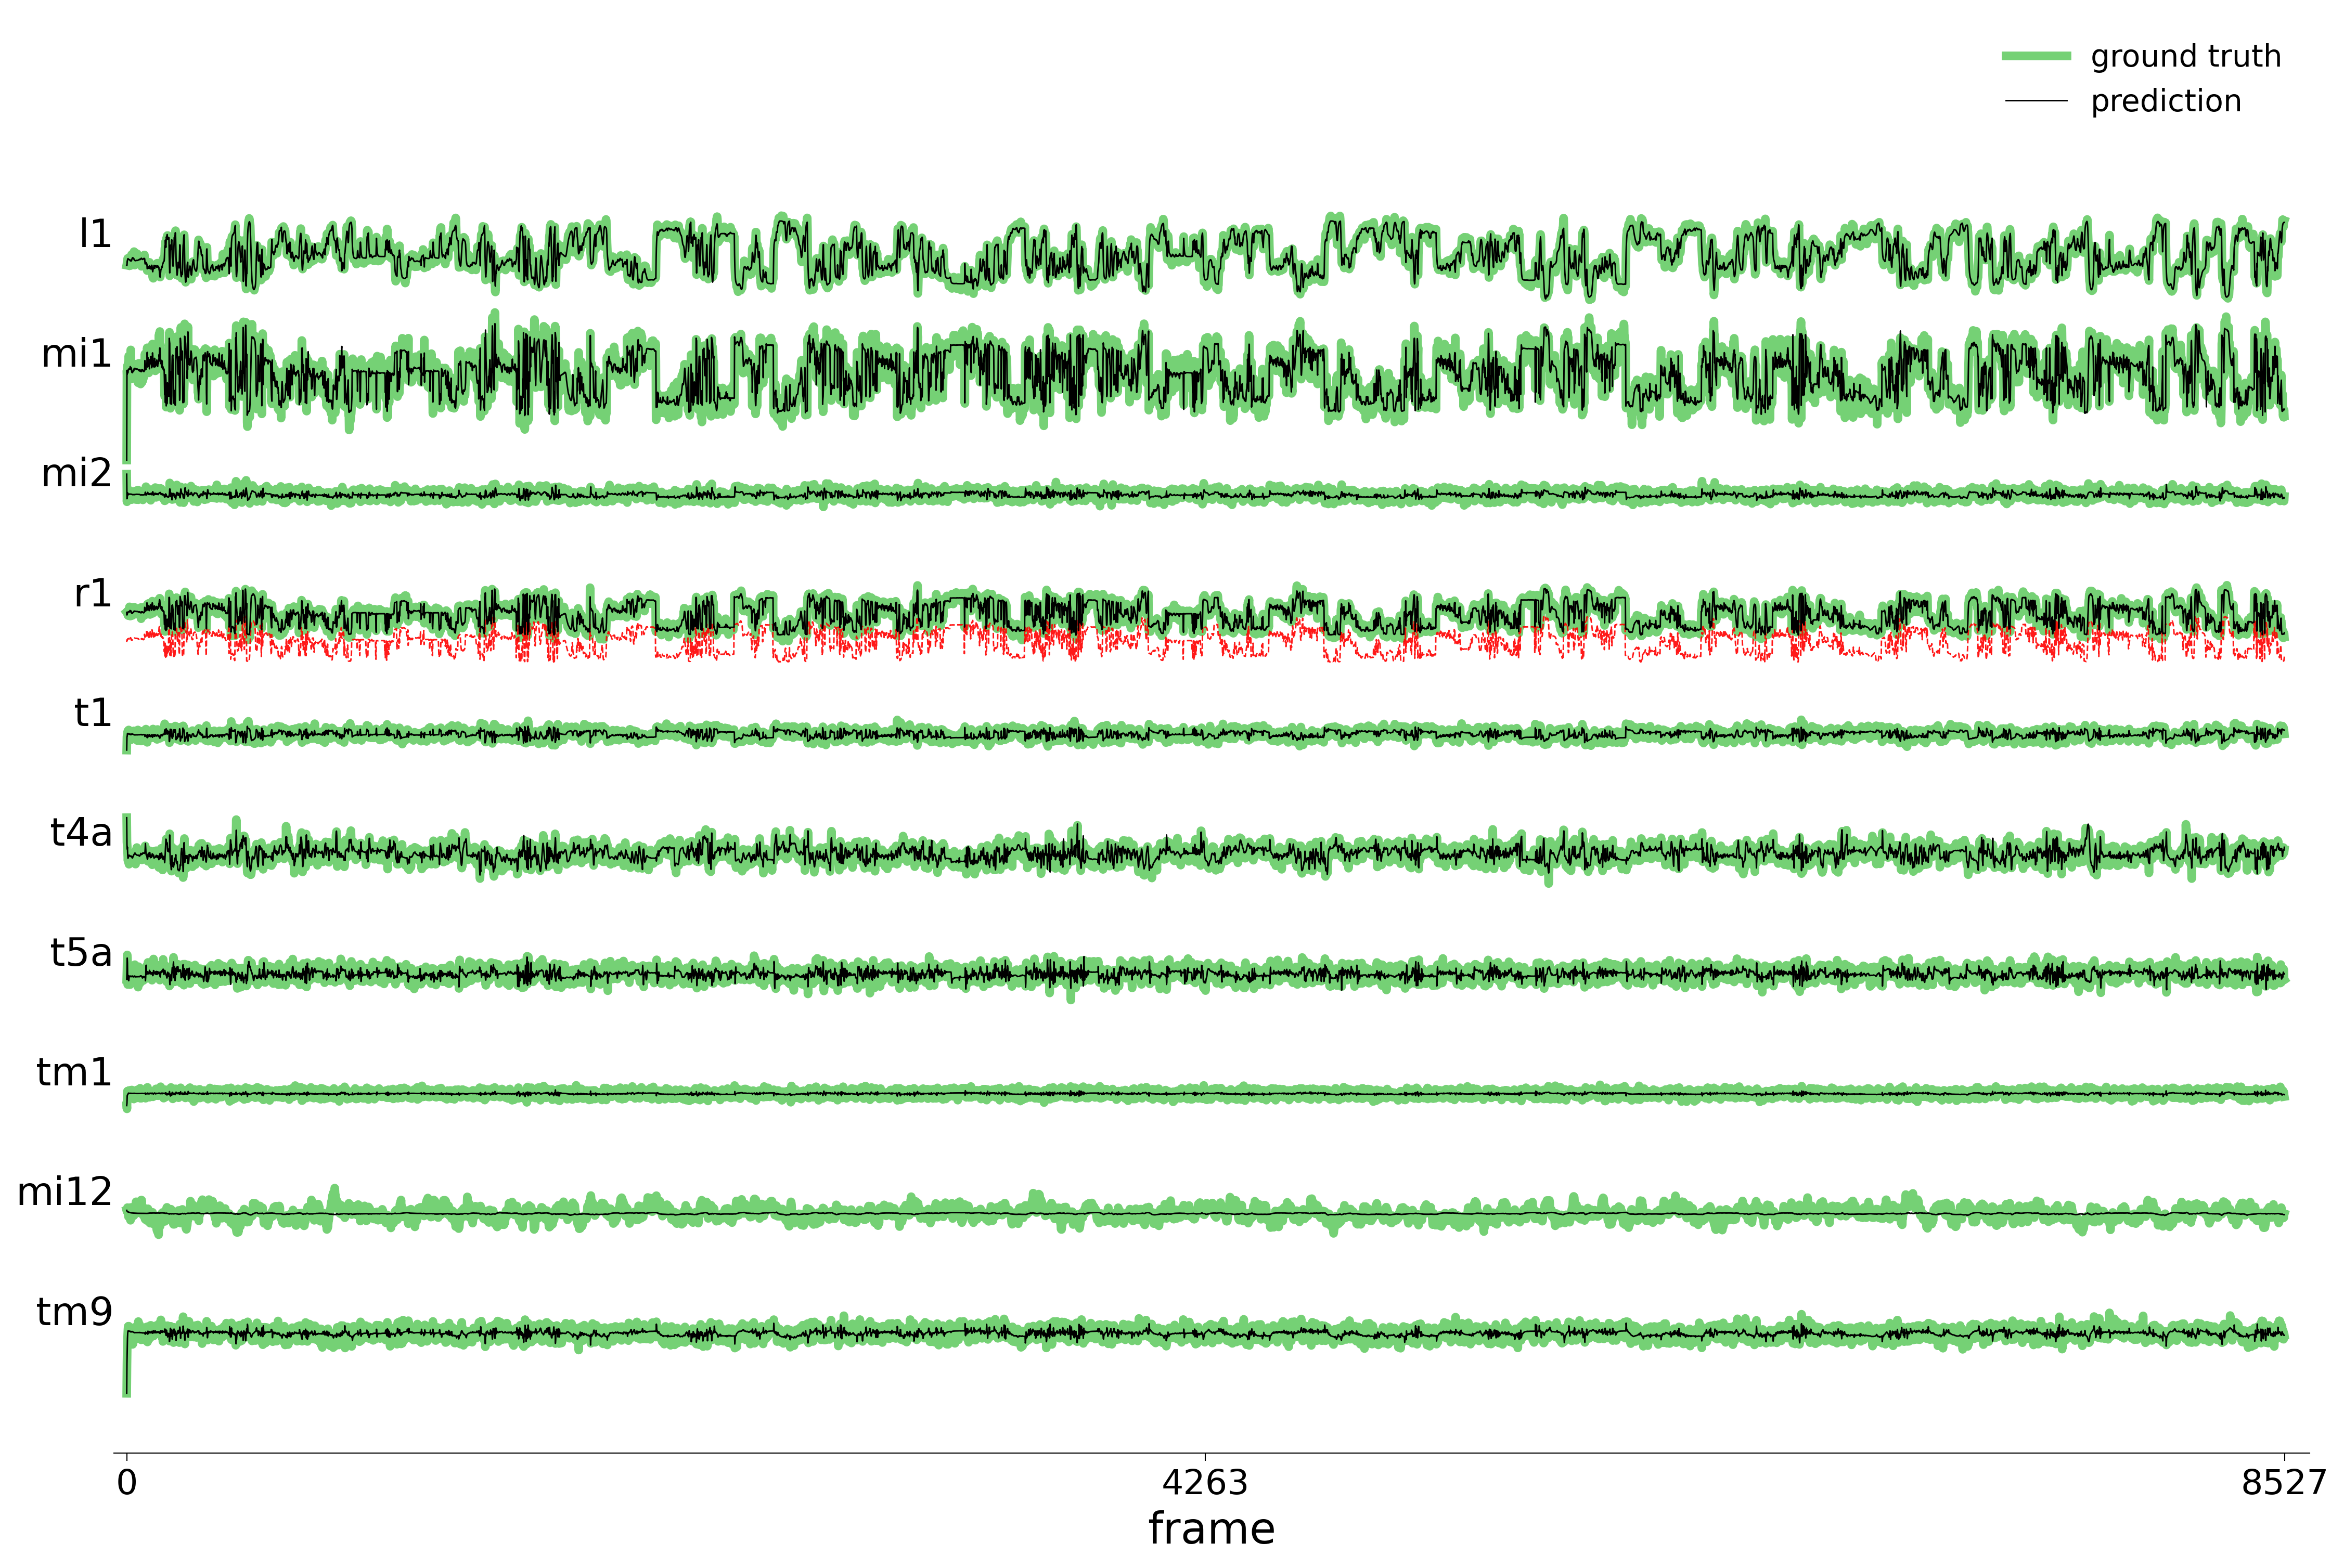
We evaluate each trained model on held-out stimuli and compute rollout predictions.
Code
for config_name, table_label, label in datasets:
    config = configs[config_name]
    gnn_log_dir = log_path(config.config_file)
    print(f"\n--- Testing {label} ---")
    data_test(
        config=config,
        visualize=True,
        style="color name continuous_slice",
        verbose=False,
        best_model='best',
        run=0,
        step=10,
        n_rollout_frames=250,
        device=device,
    )
Rollout Traces
2% edges removed (8,682 removed / 425,430 remaining)

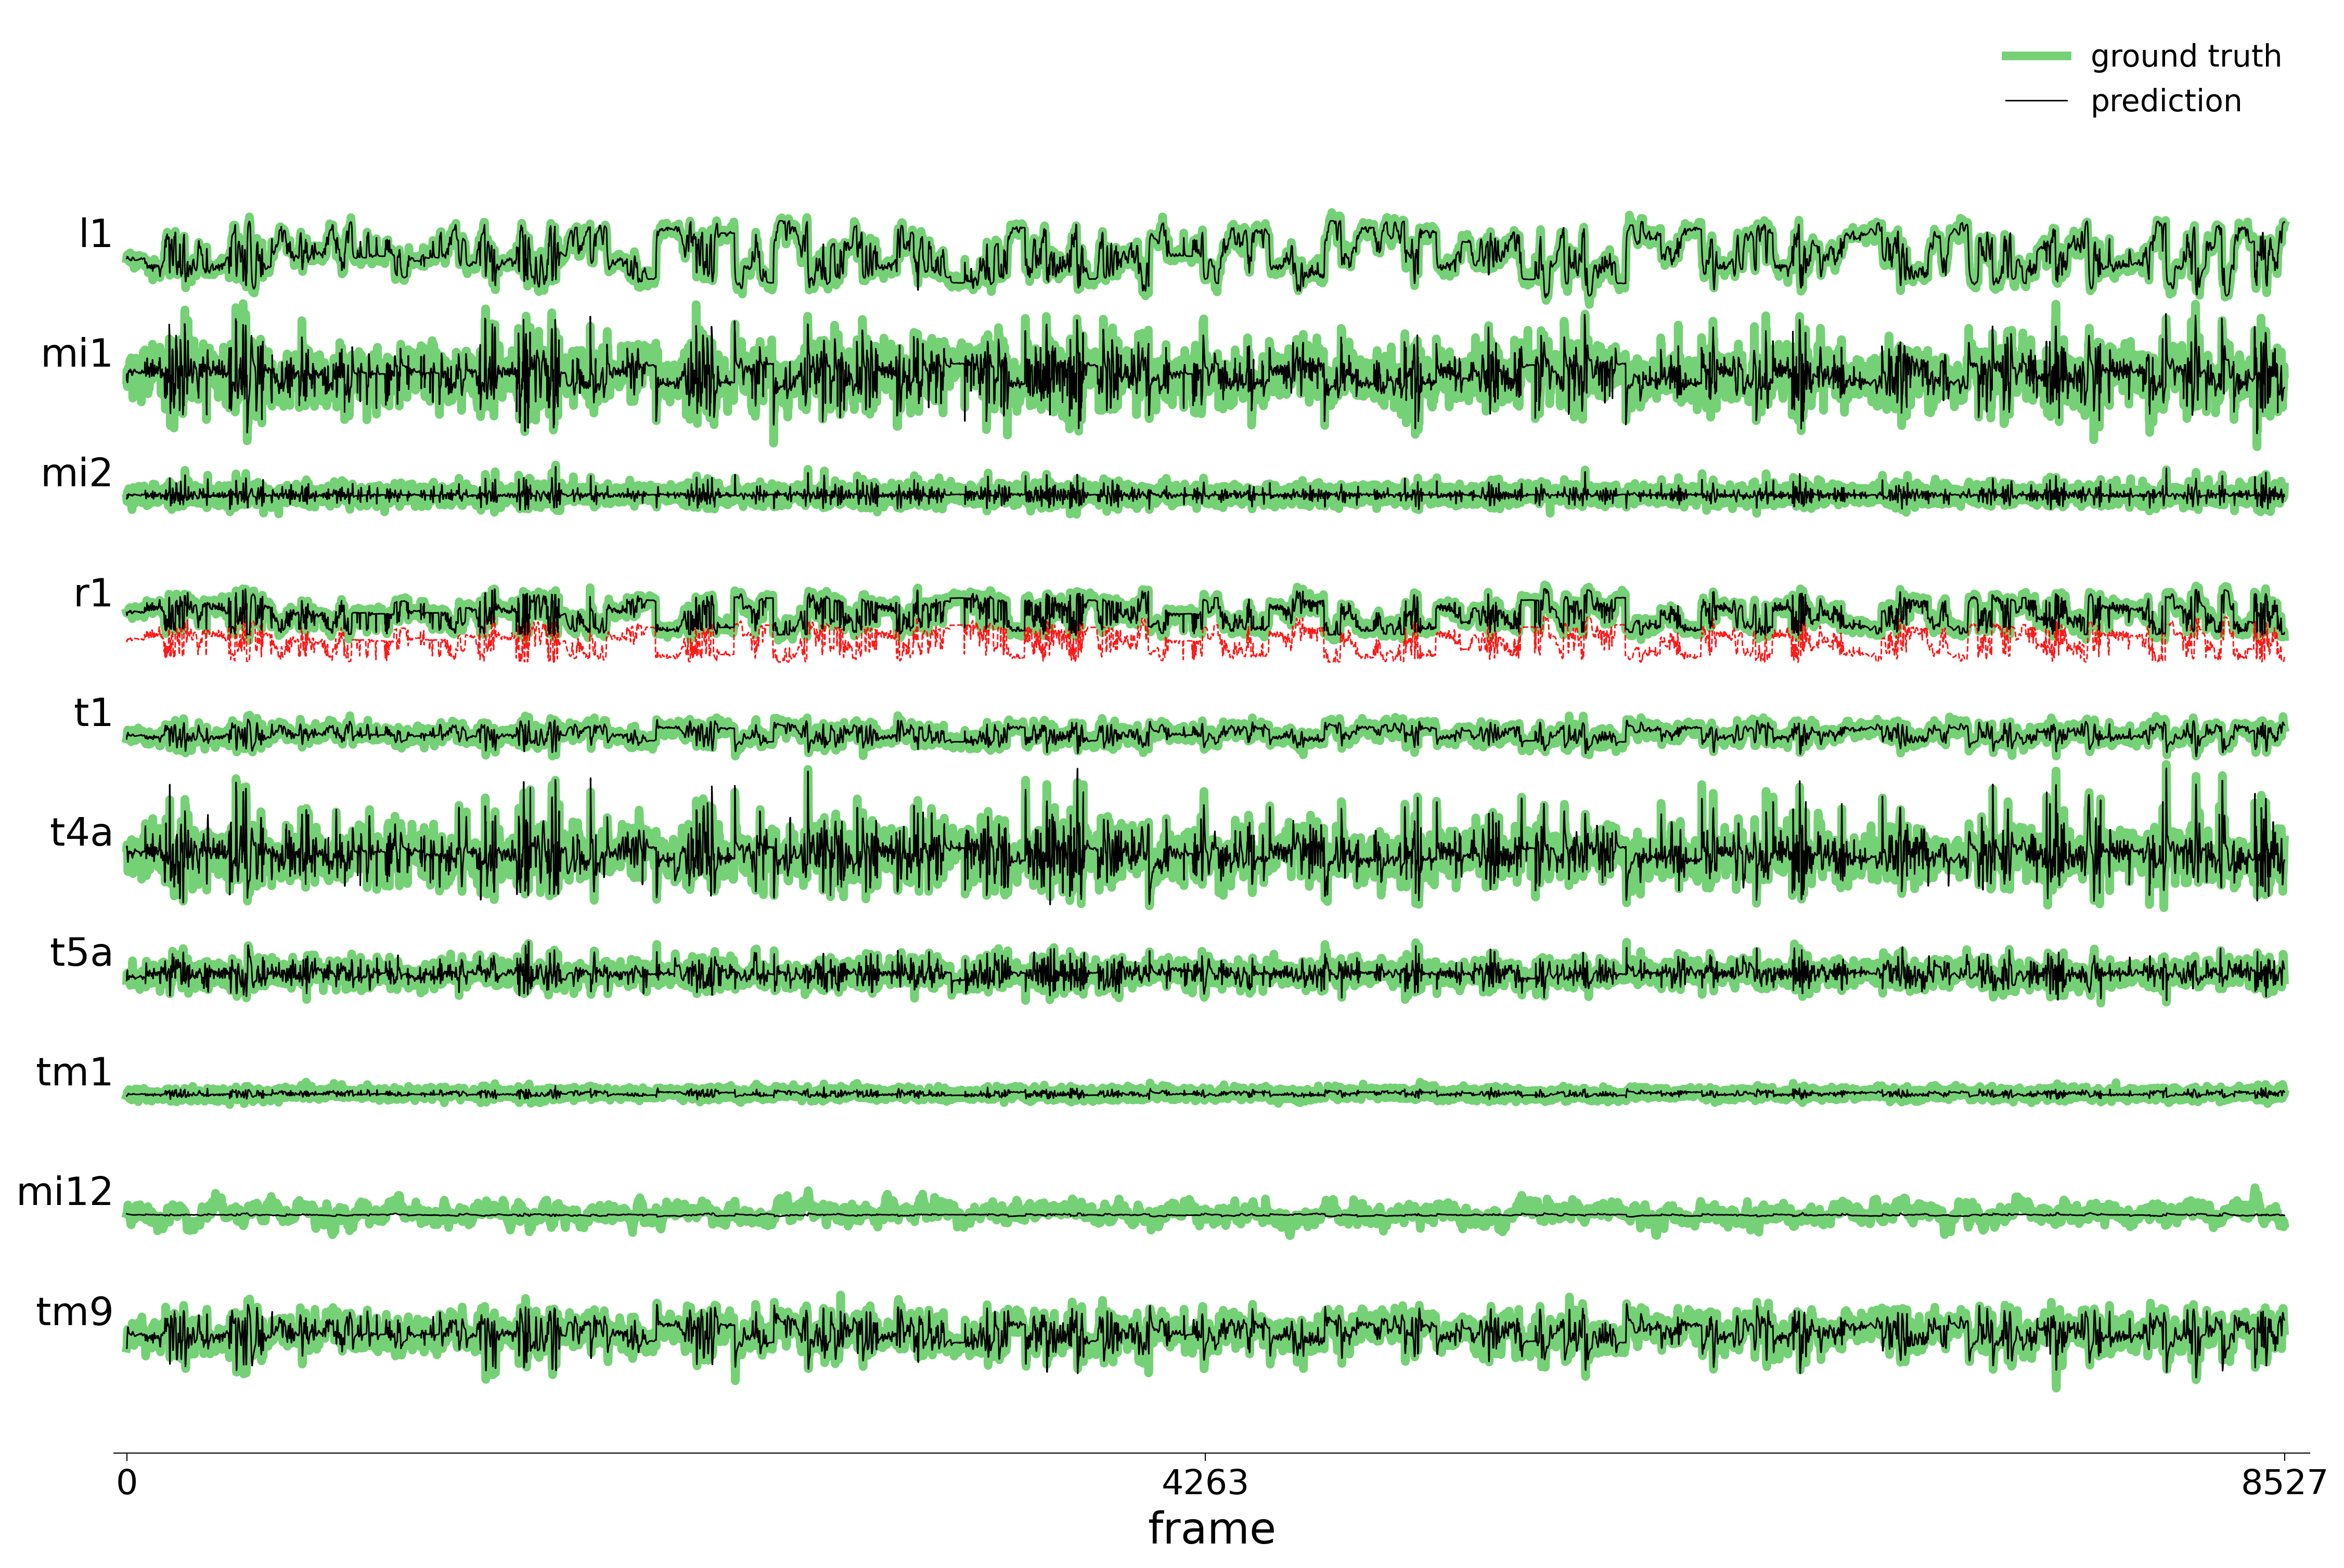
5% edges removed (21,706 removed / 412,406 remaining)
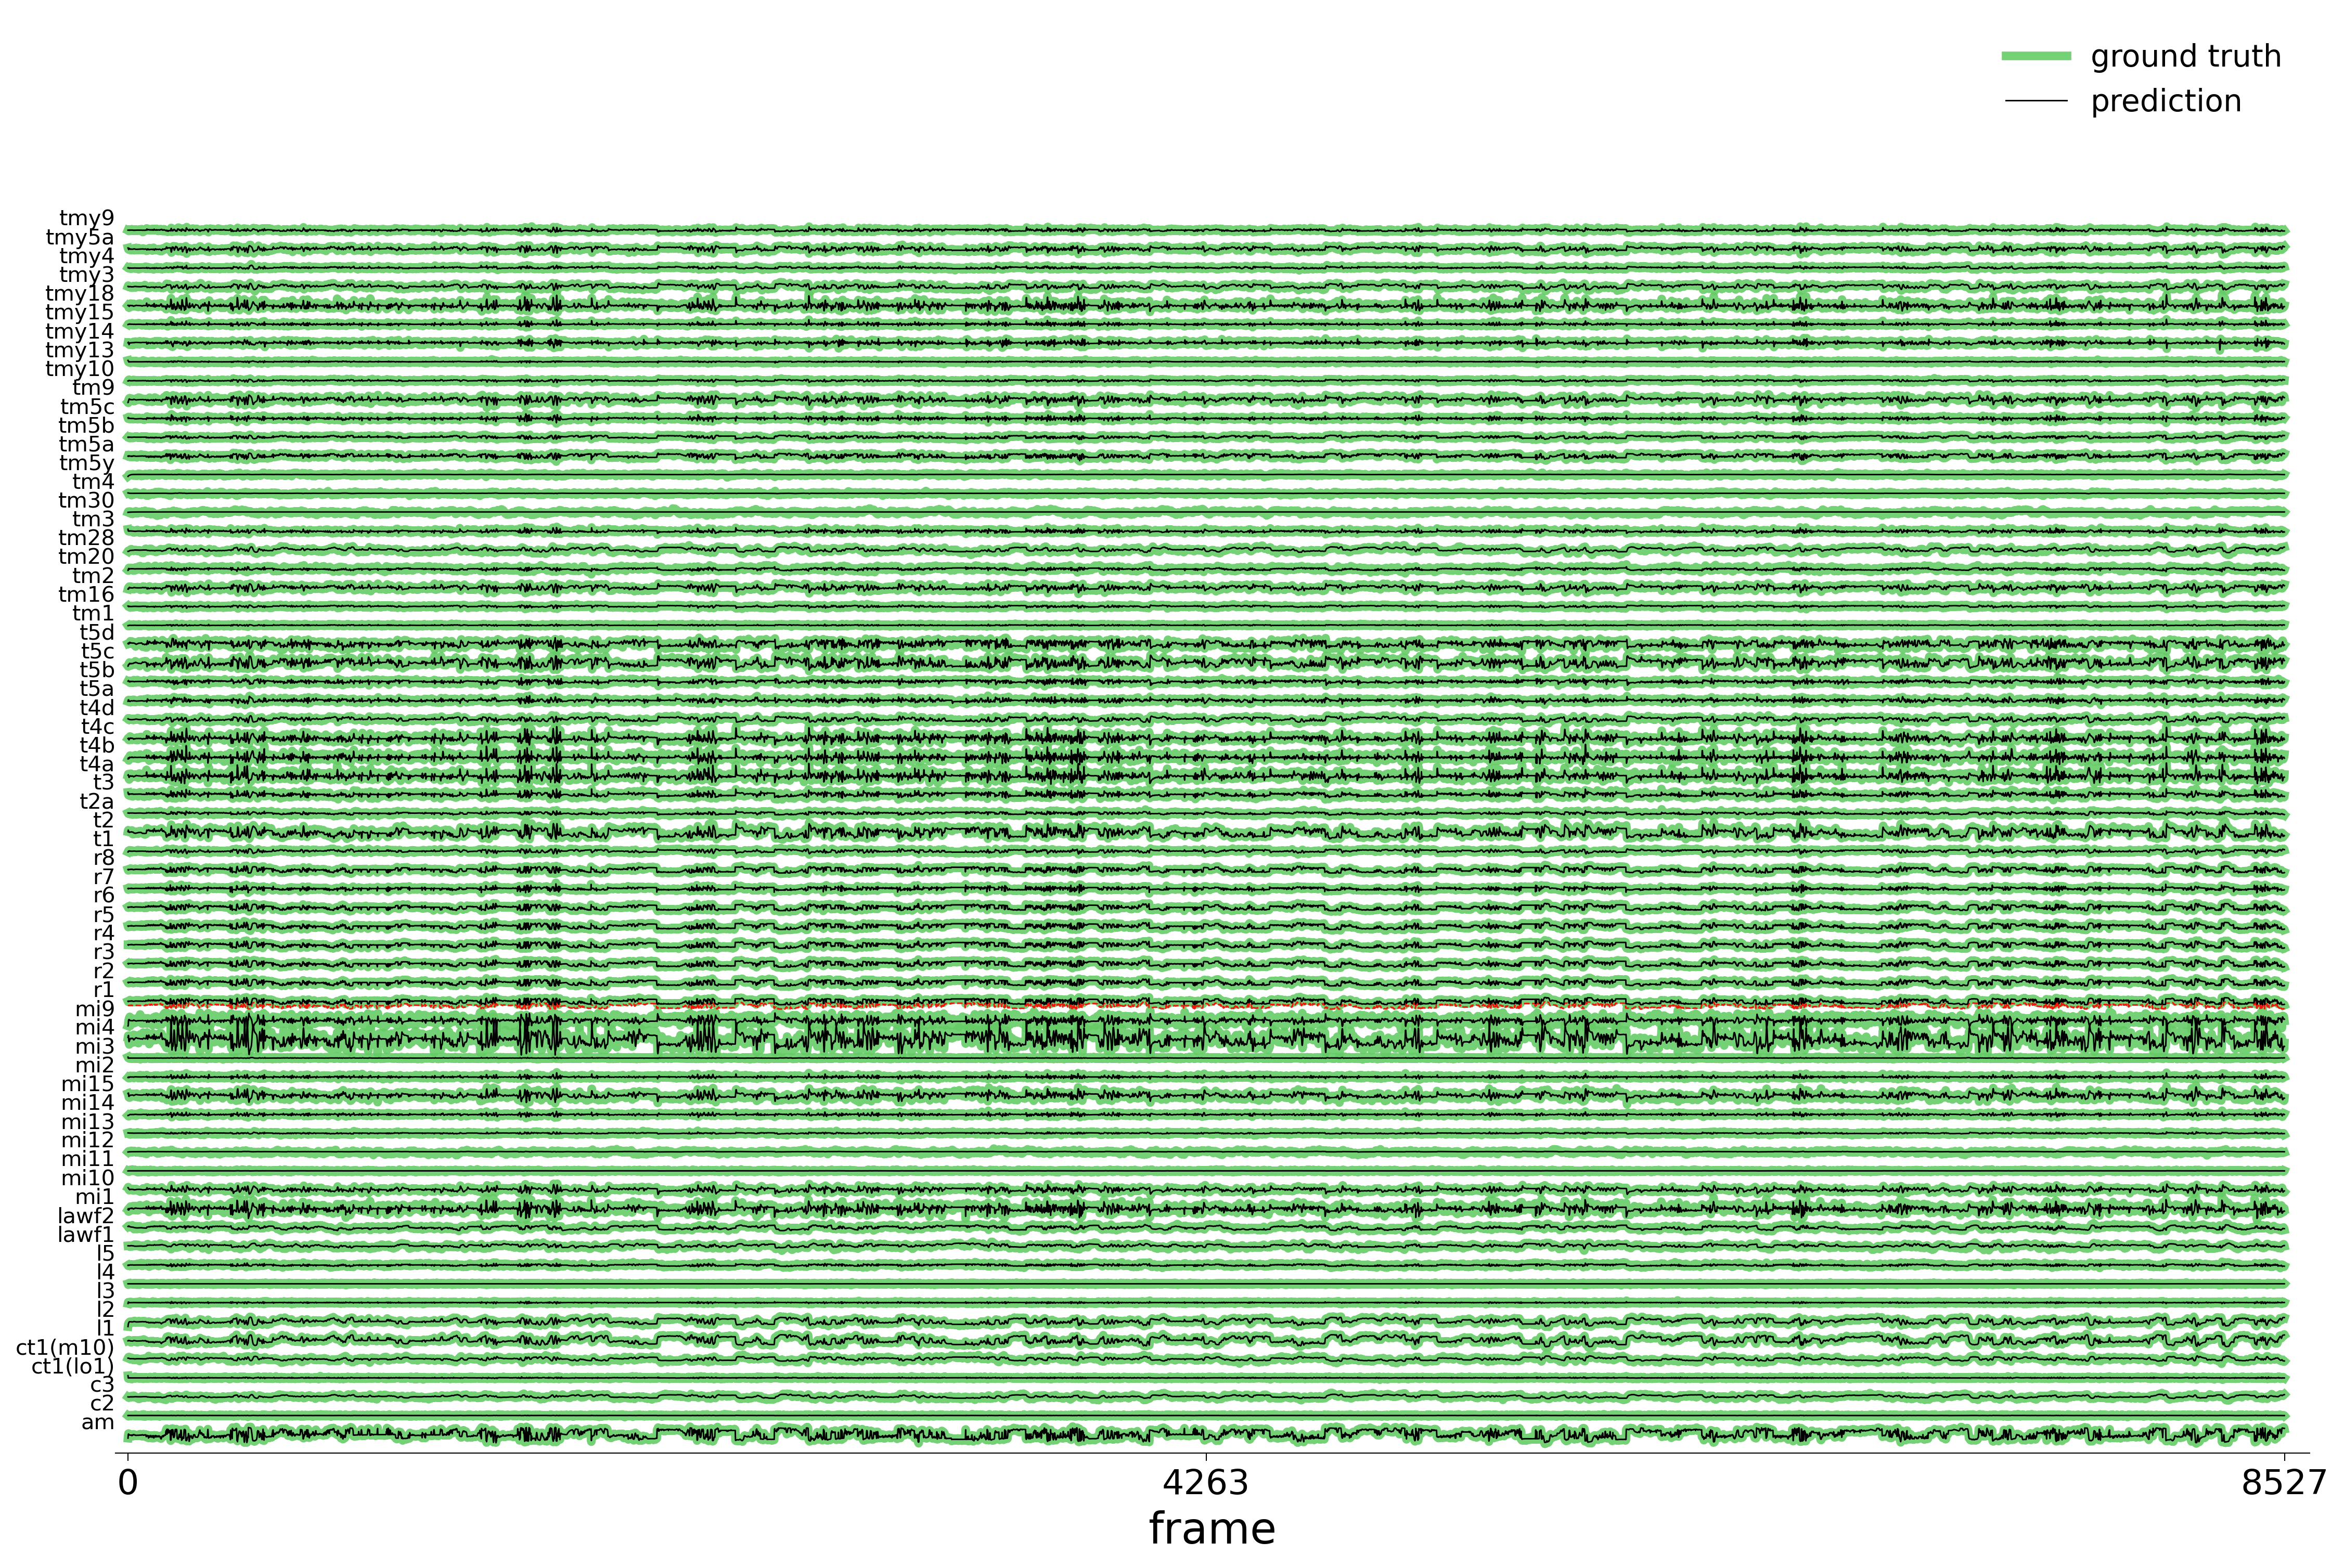
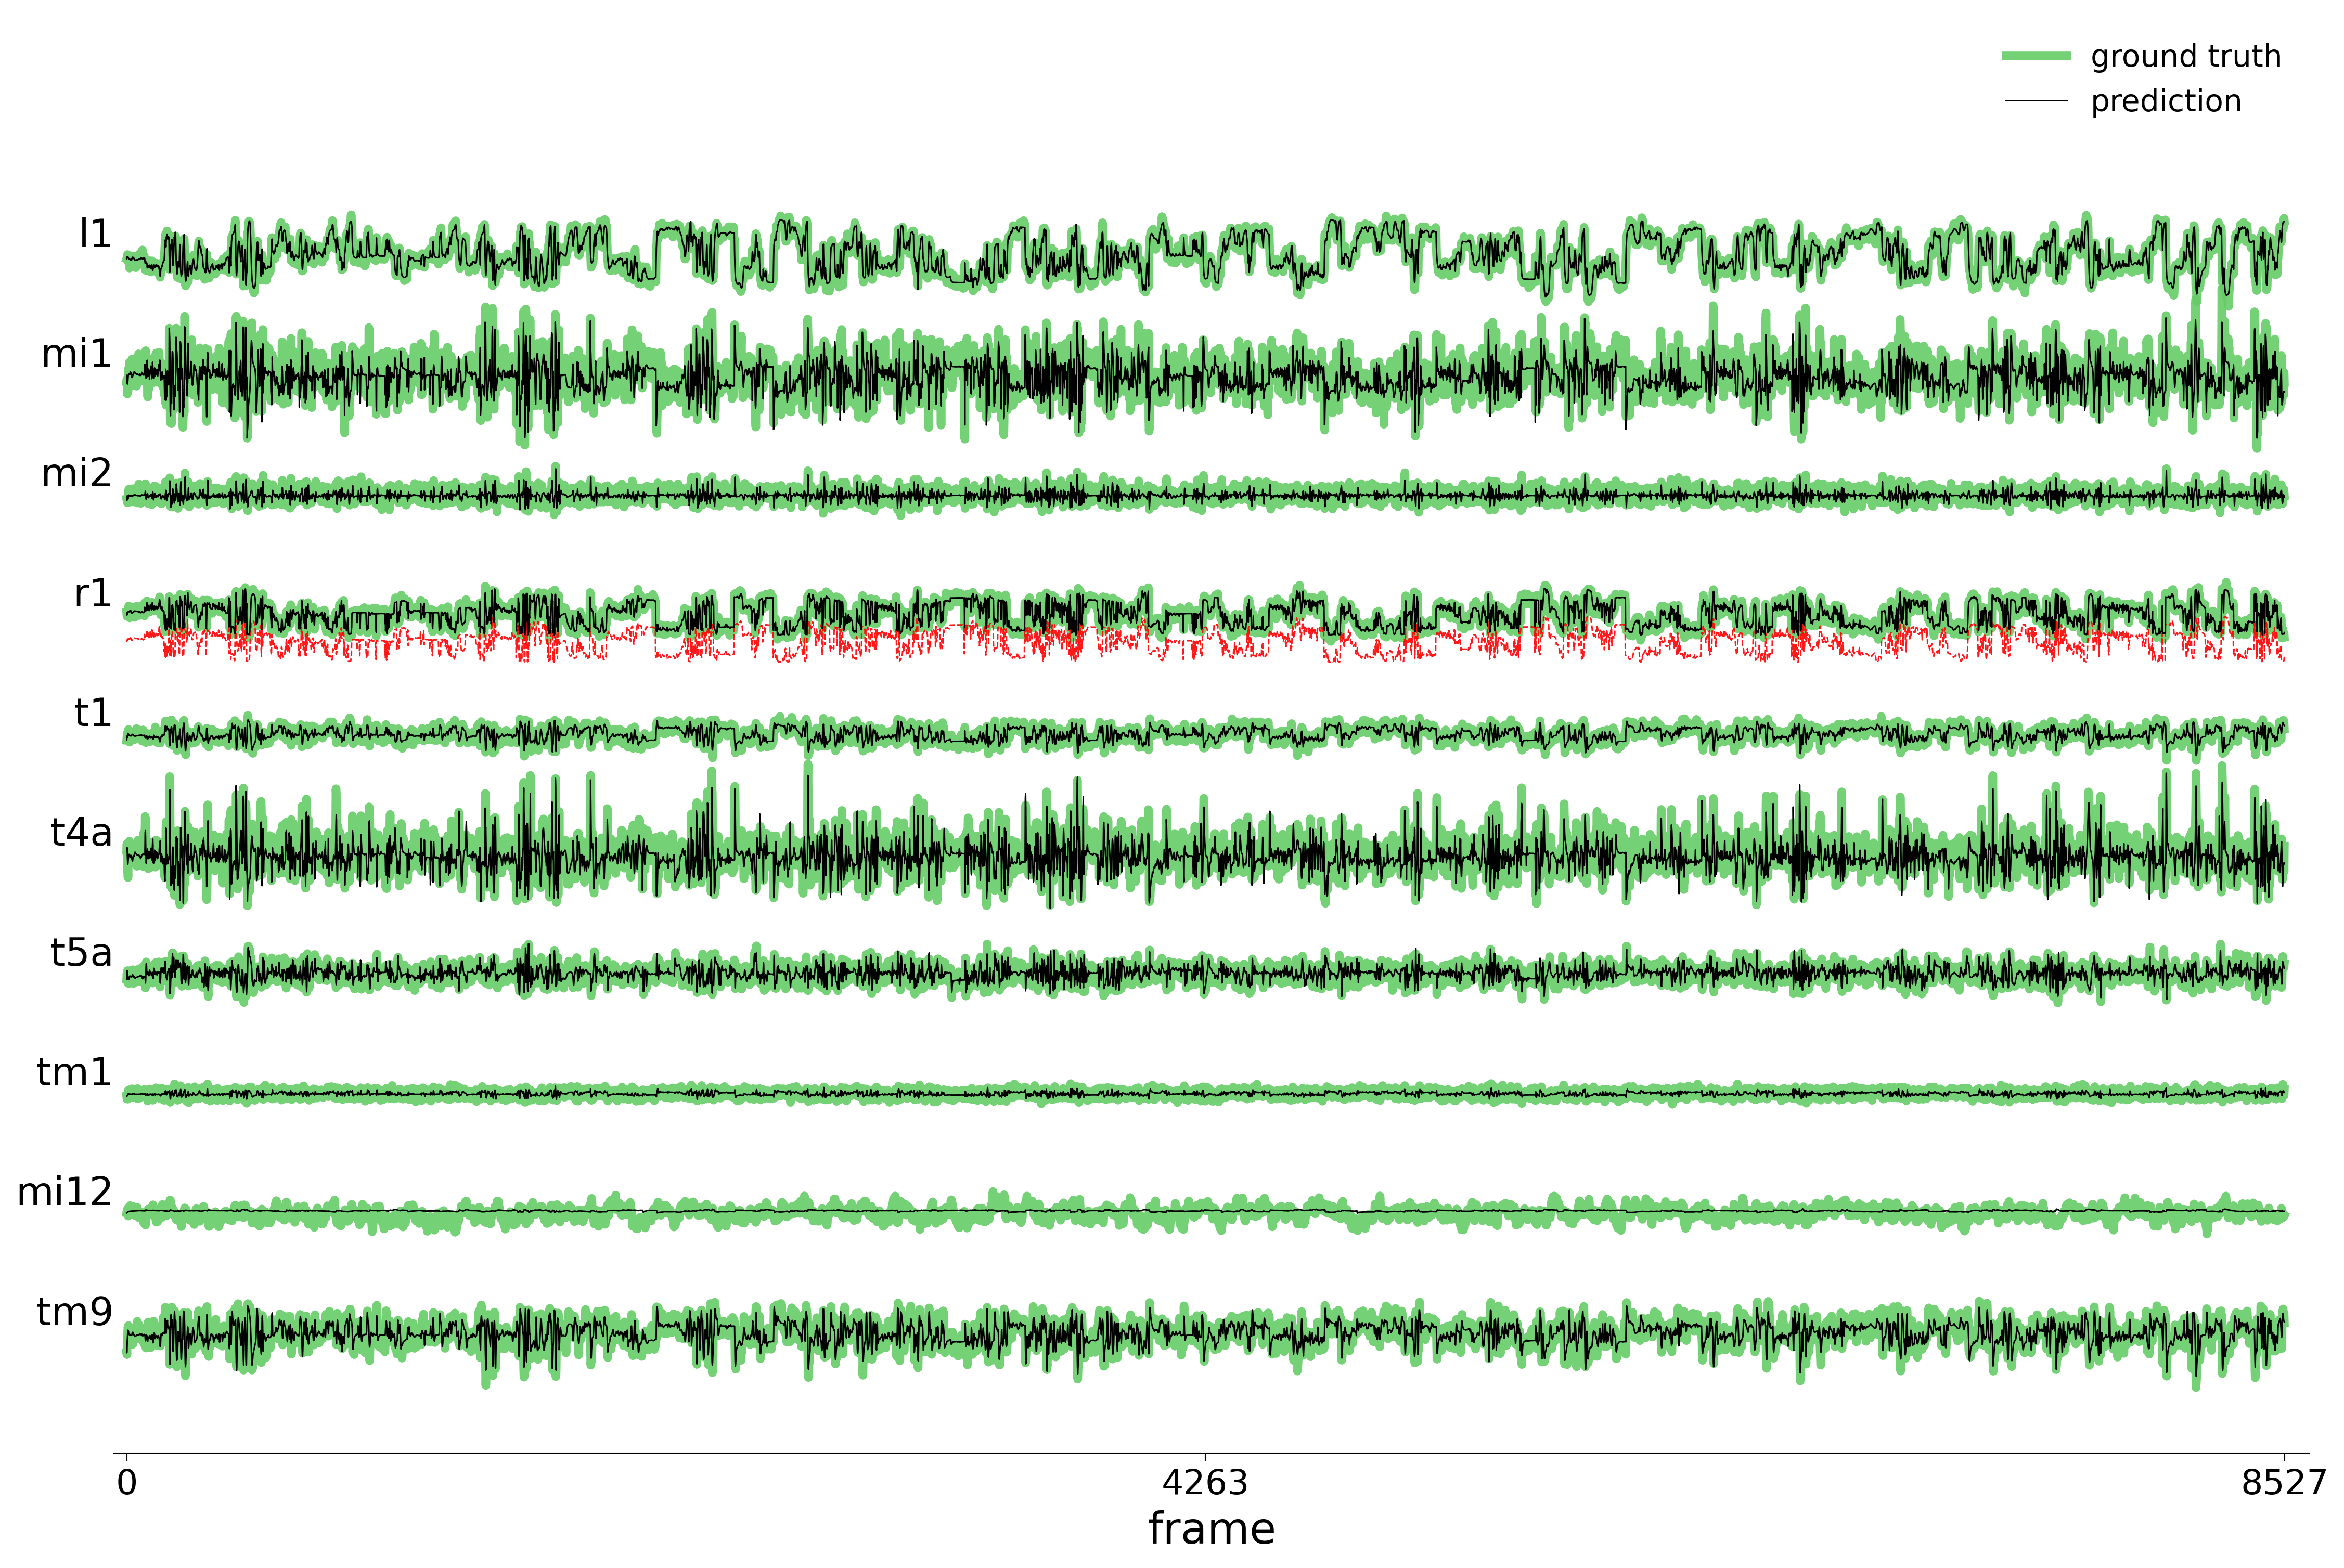
10% edges removed (43,411 removed / 390,701 remaining)
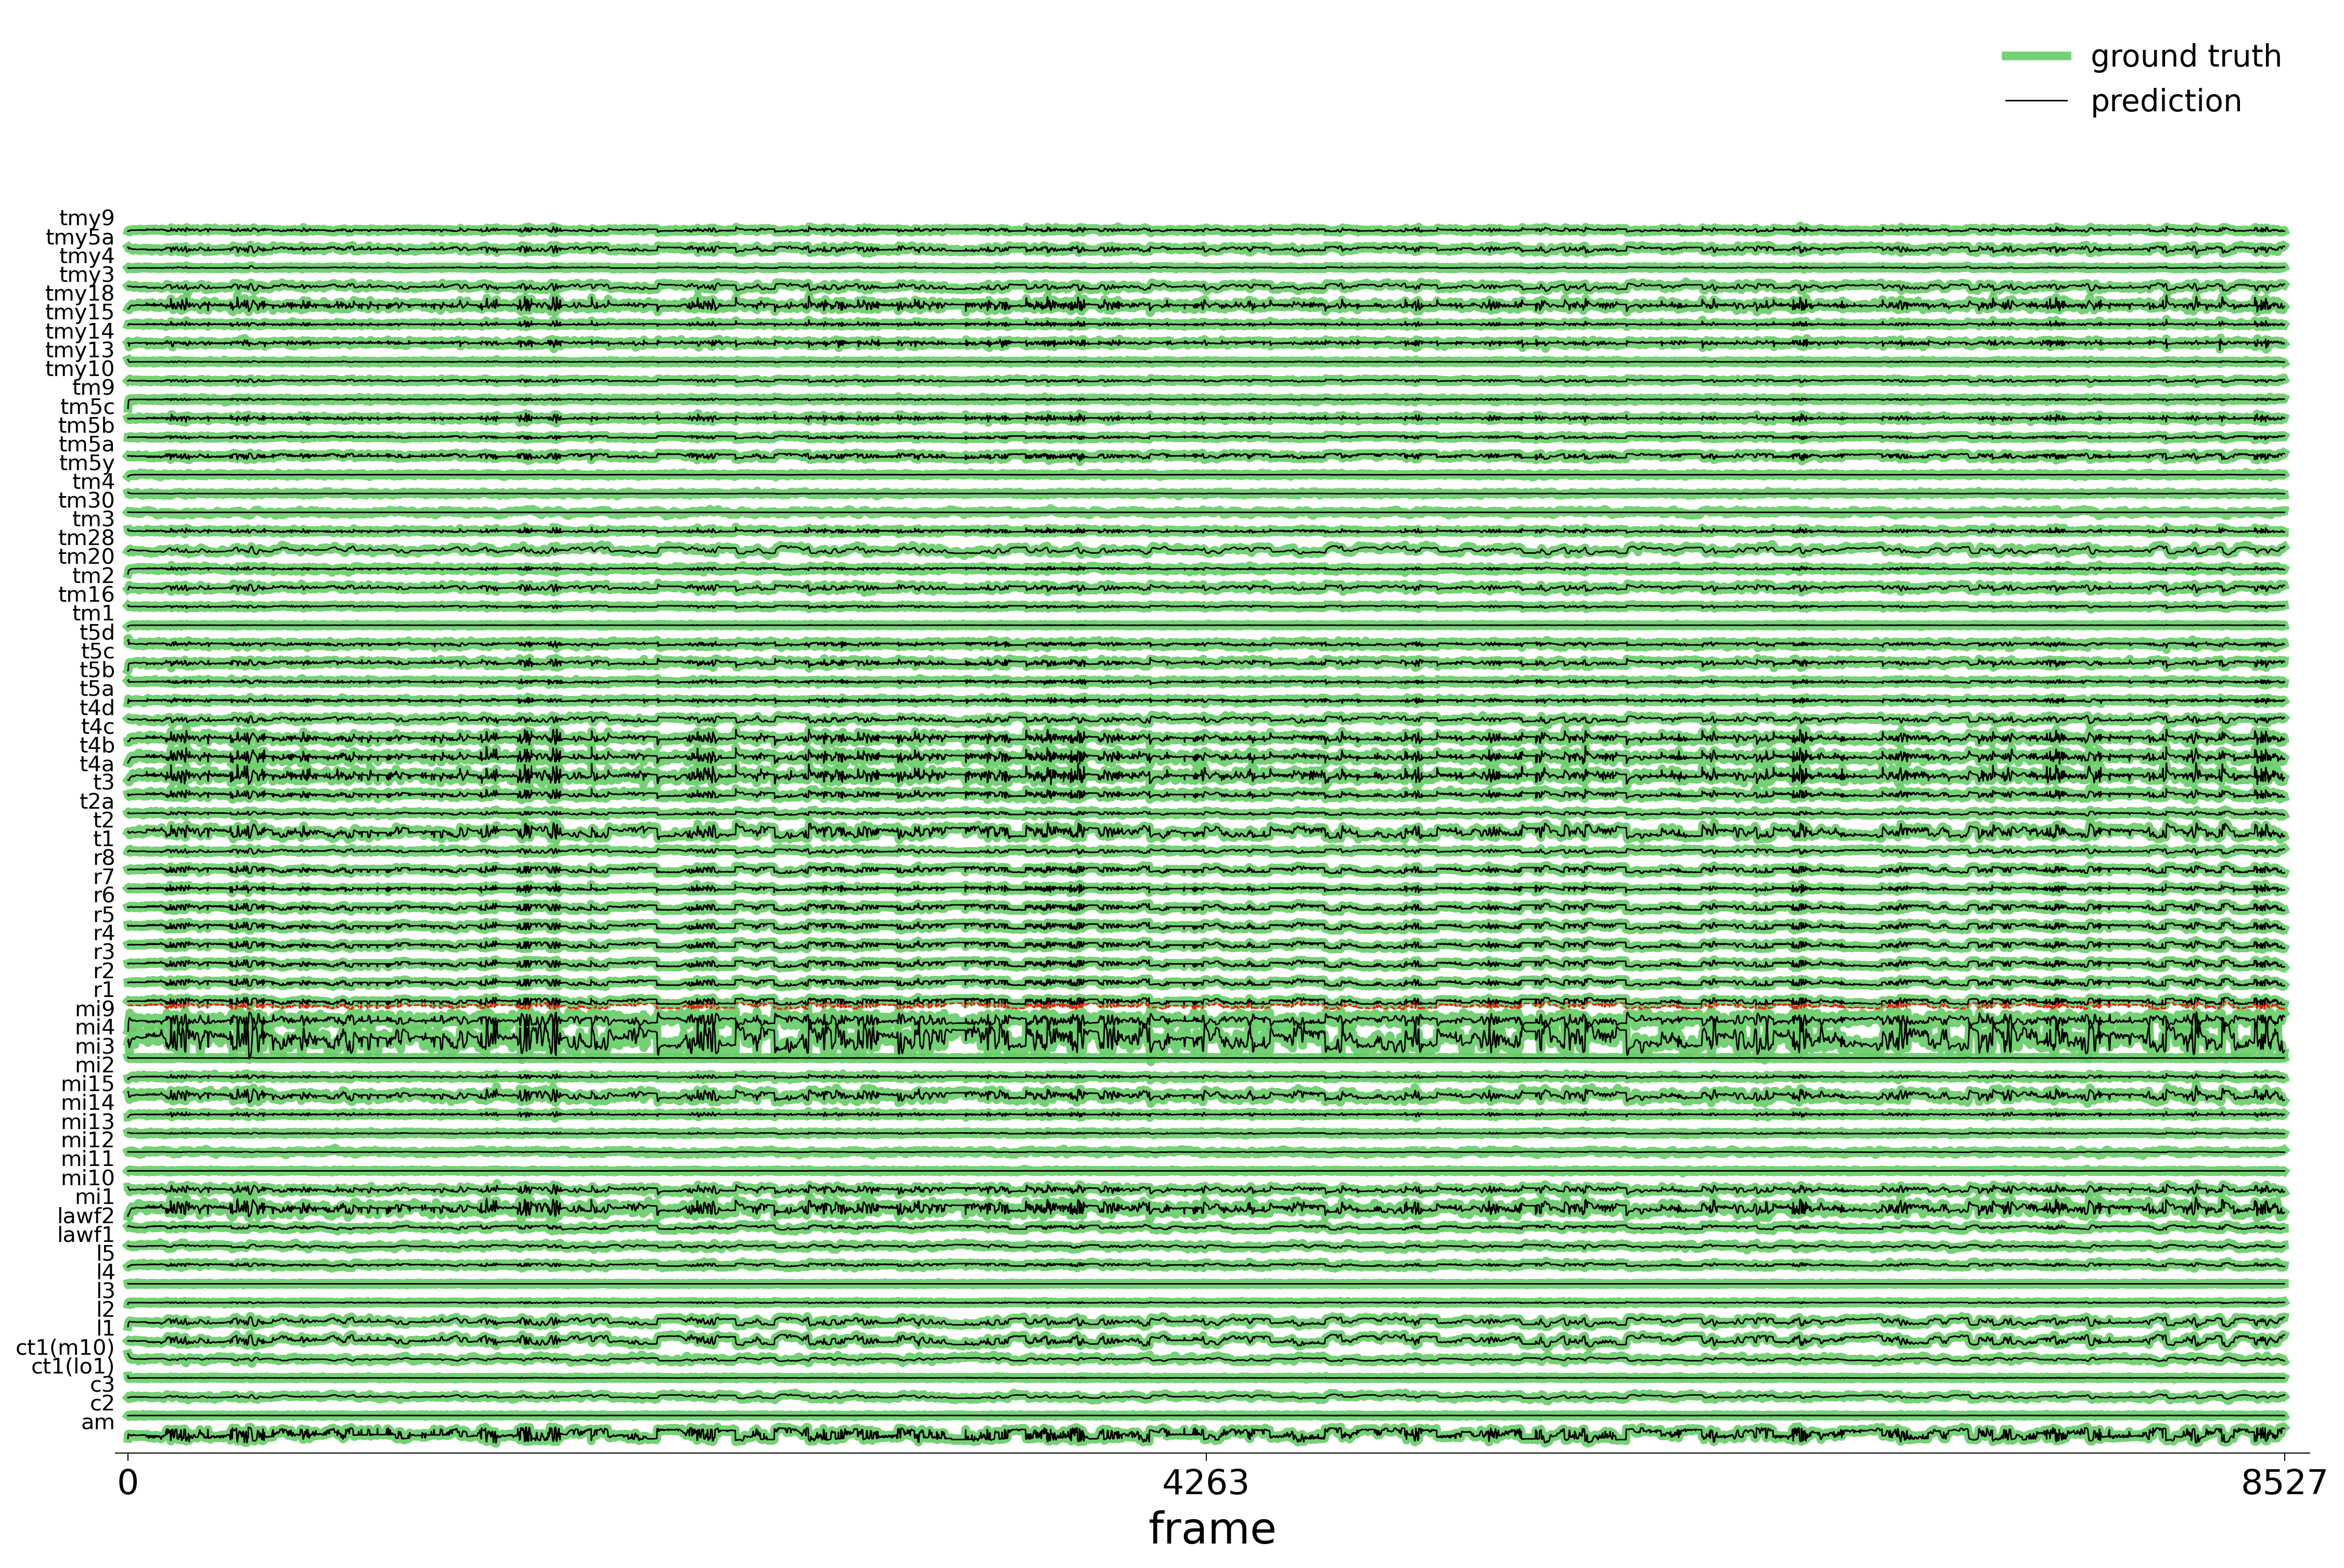
20% edges removed (86,822 removed / 347,290 remaining)
GNN Analysis: Learned Representations
We run the same analysis as Notebook 04 on each edge-removal model to assess whether circuit recovery is preserved despite the incomplete adjacency matrix.
Code
for config_name, table_label, label in datasets:
    config = configs[config_name]
    print(f"\n--- Generating analysis plots for {label} ---")
    data_plot(
        config=config,
        config_file=config.config_file,
        epoch_list=['best'],
        style='color',
        extended='plots',
        device=device,
    )
Corrected Weights (\(W\))
2% edges removed (8,682 removed / 425,430 remaining)
5% edges removed (21,706 removed / 412,406 remaining)

10% edges removed (43,411 removed / 390,701 remaining)

20% edges removed (86,822 removed / 347,290 remaining)
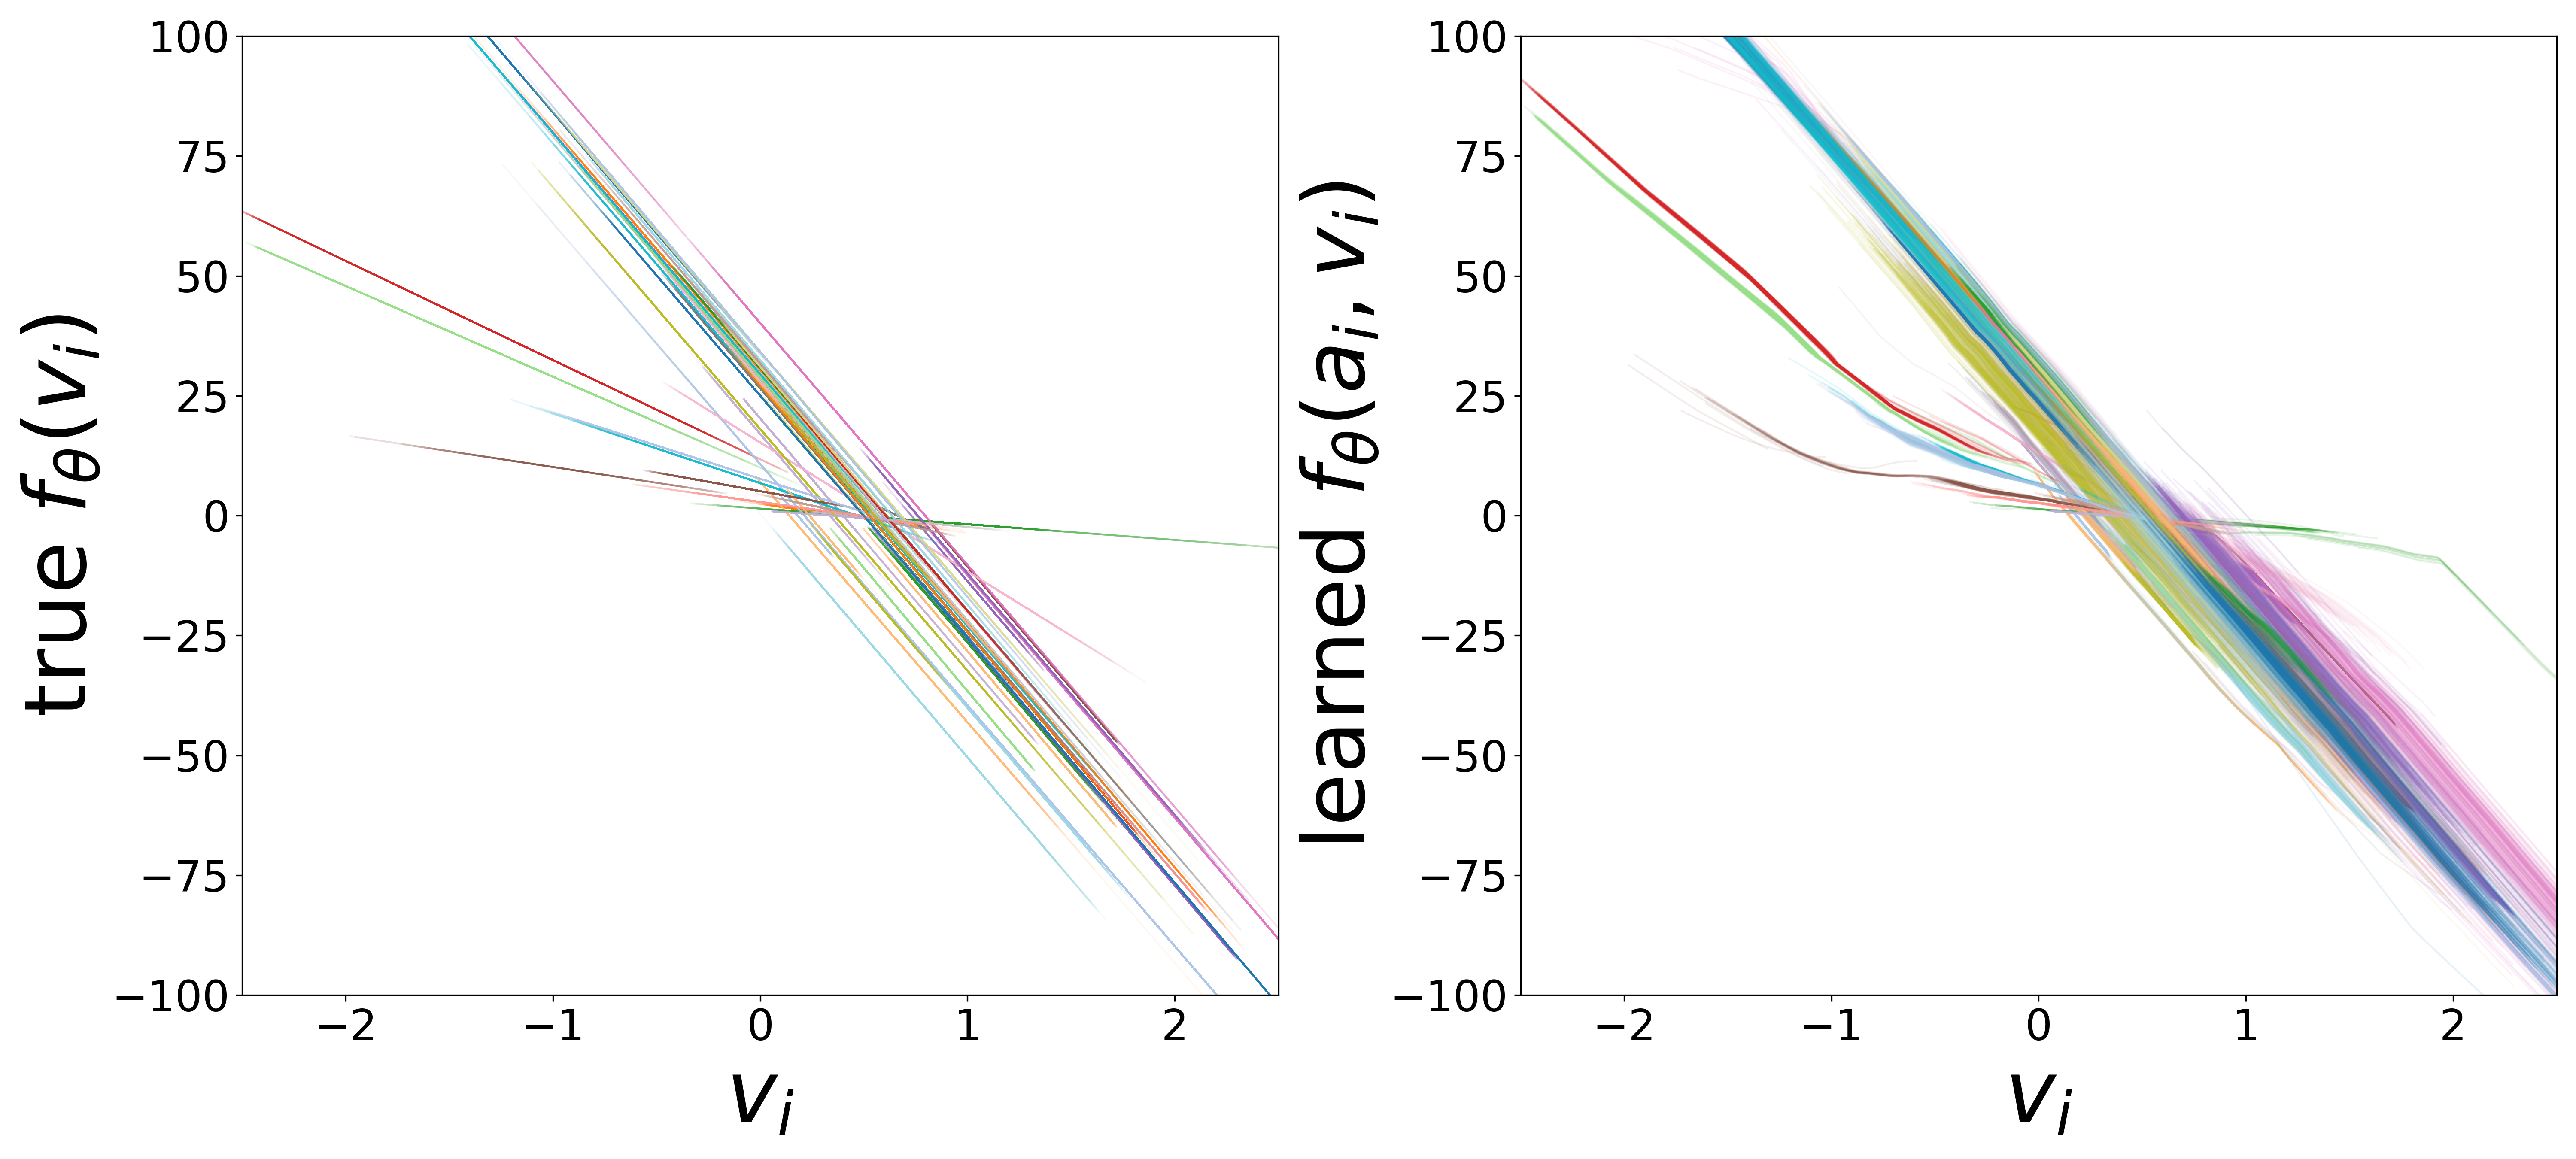
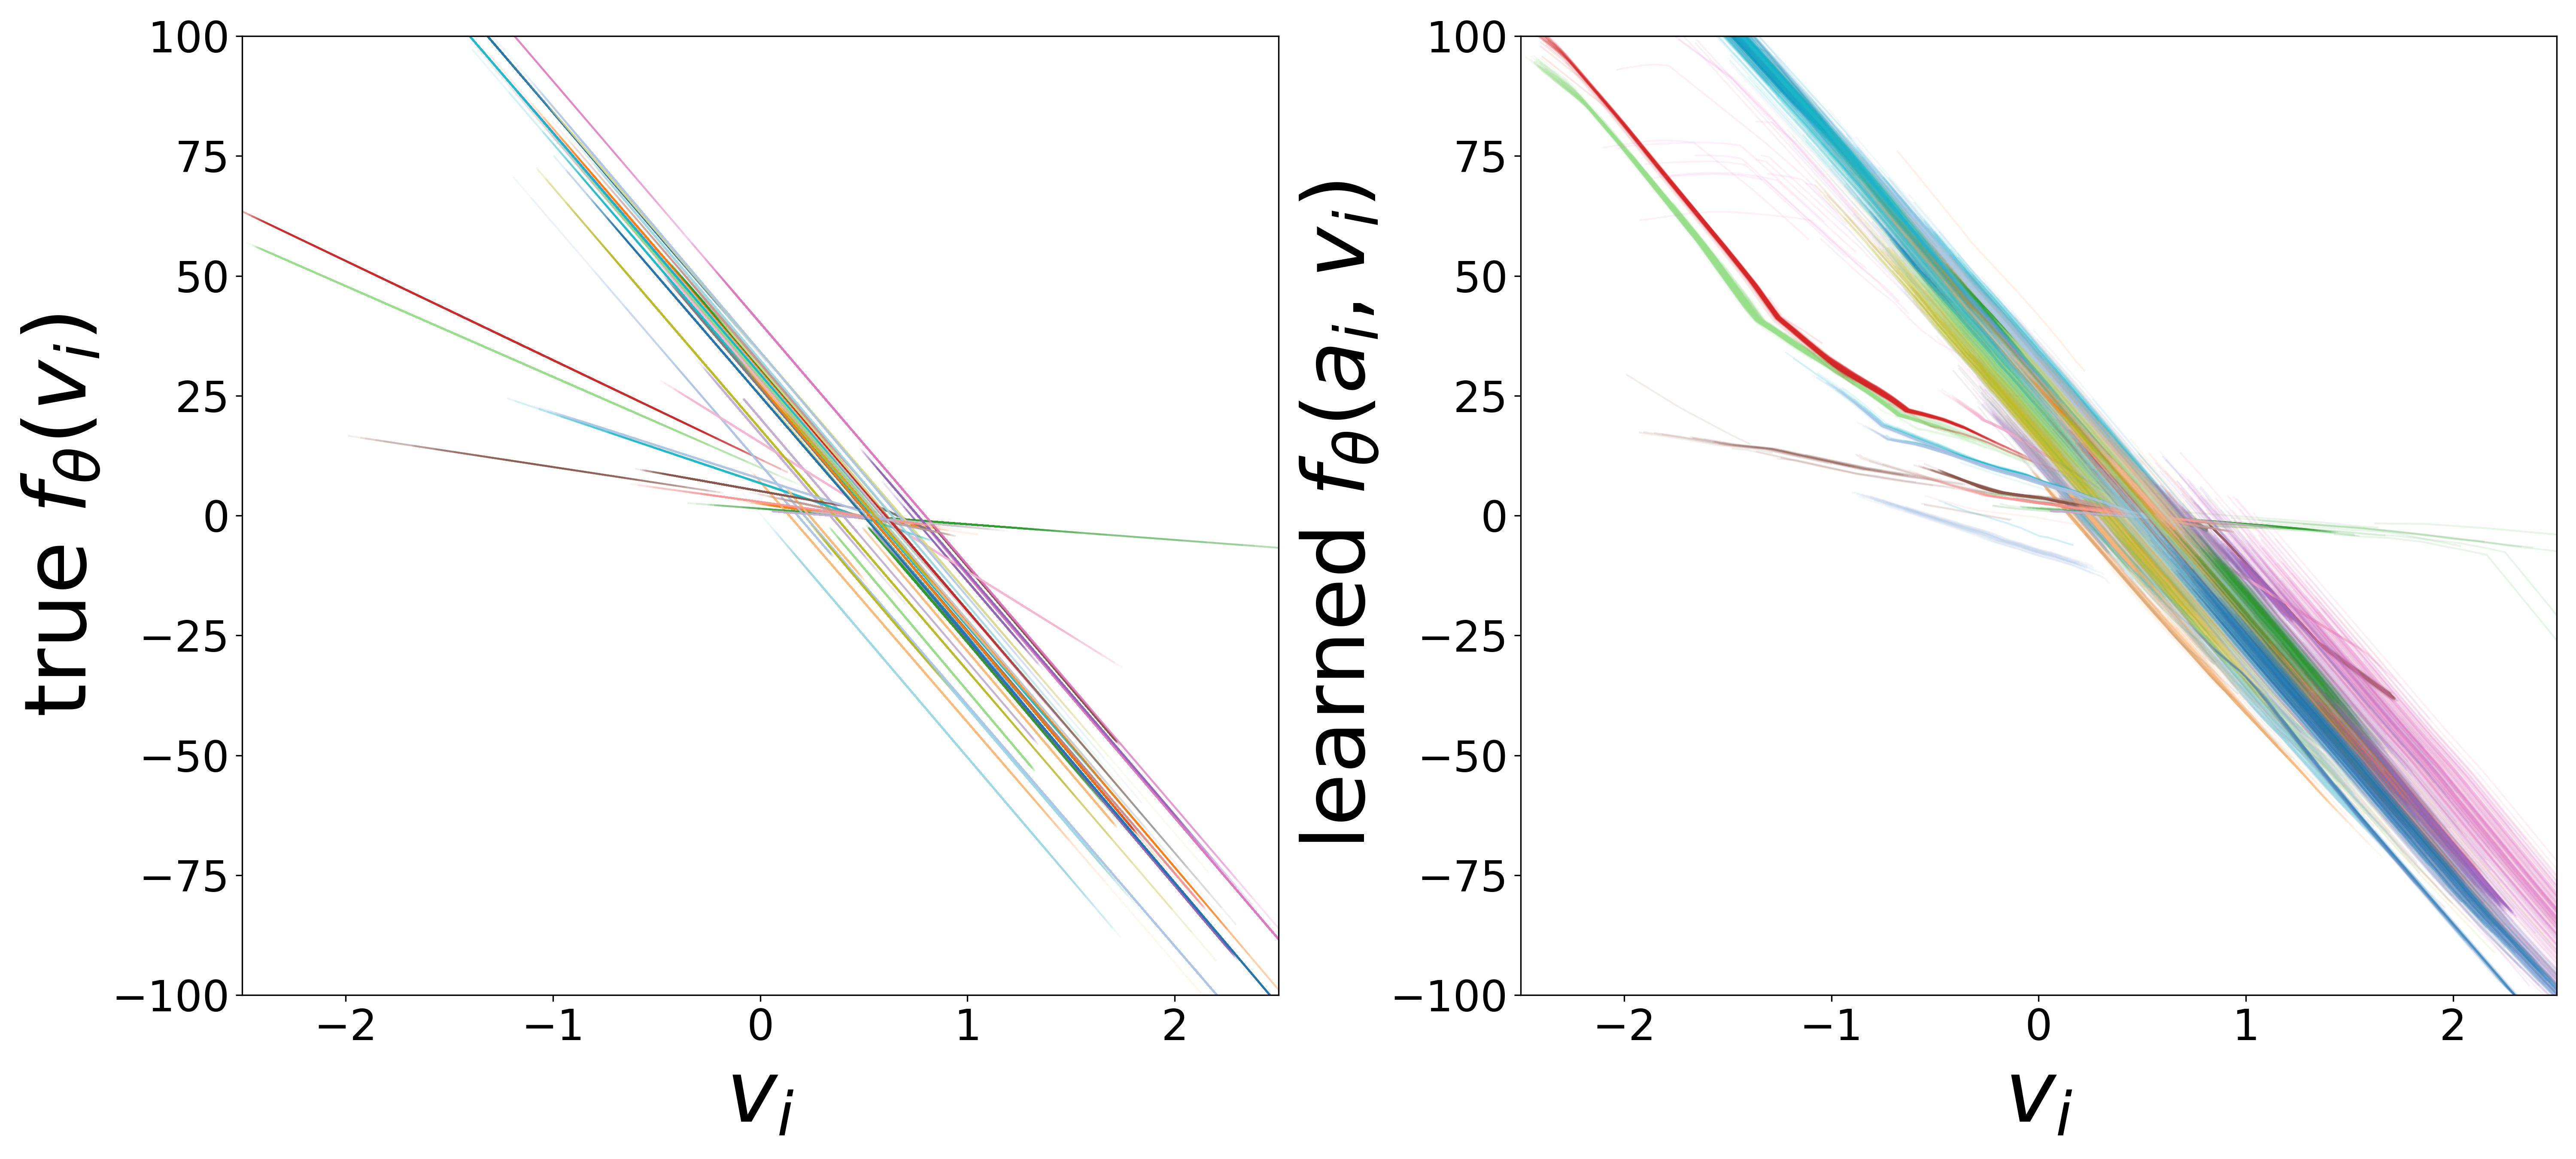
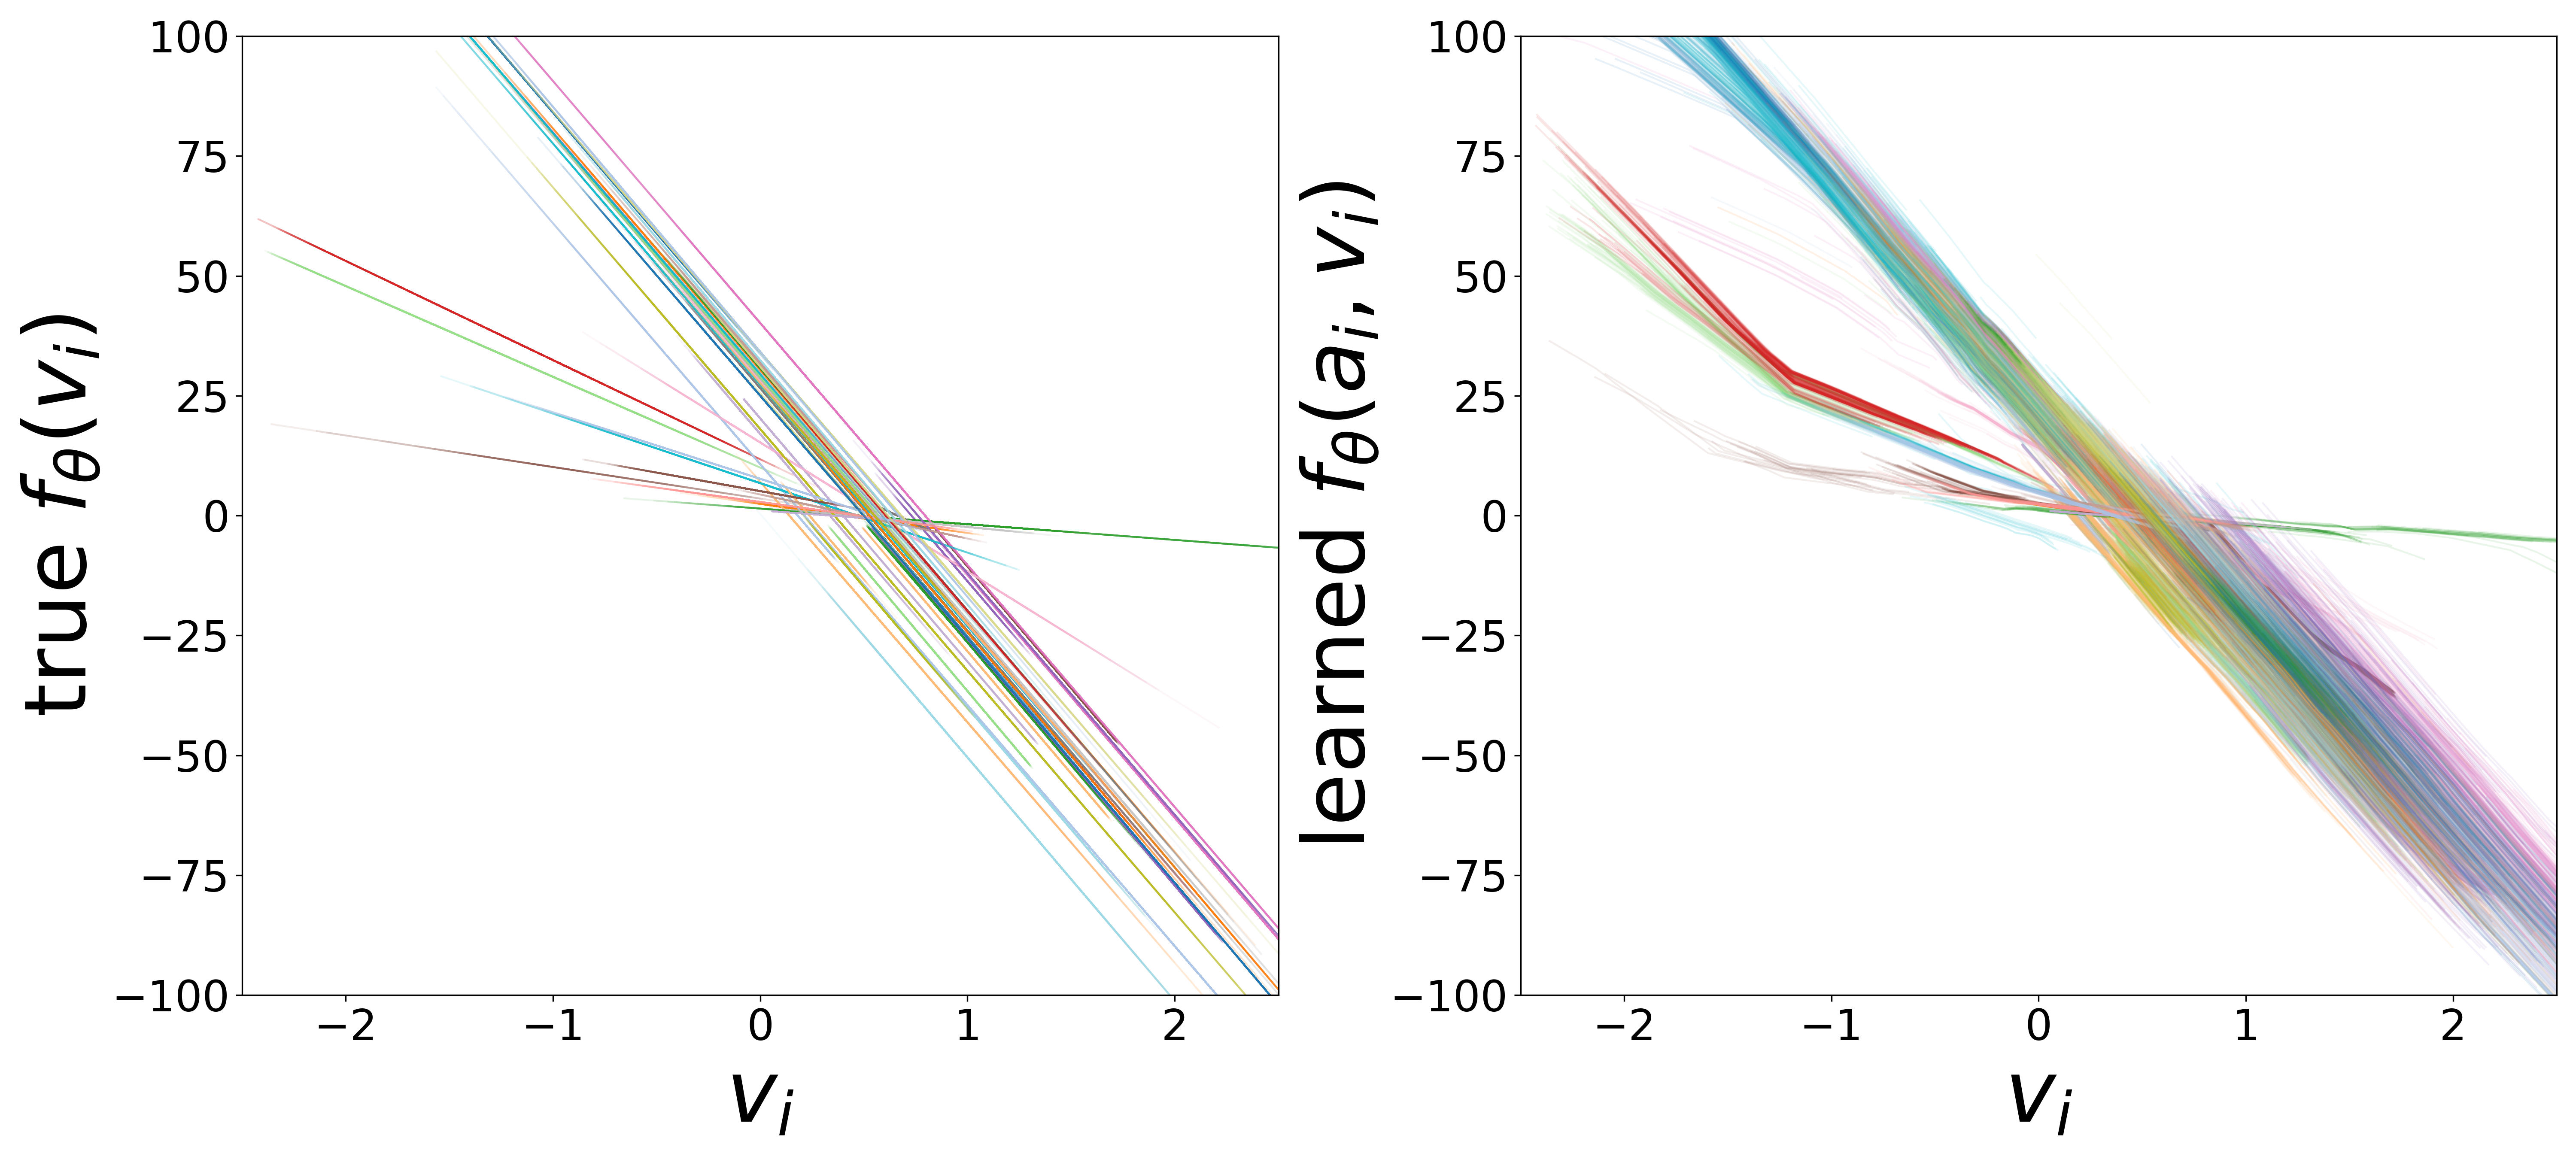
\(f_\theta\) (MLP\(_0\)): Neuron Update Function
2% edges removed (8,682 removed / 425,430 remaining)
5% edges removed (21,706 removed / 412,406 remaining)
10% edges removed (43,411 removed / 390,701 remaining)
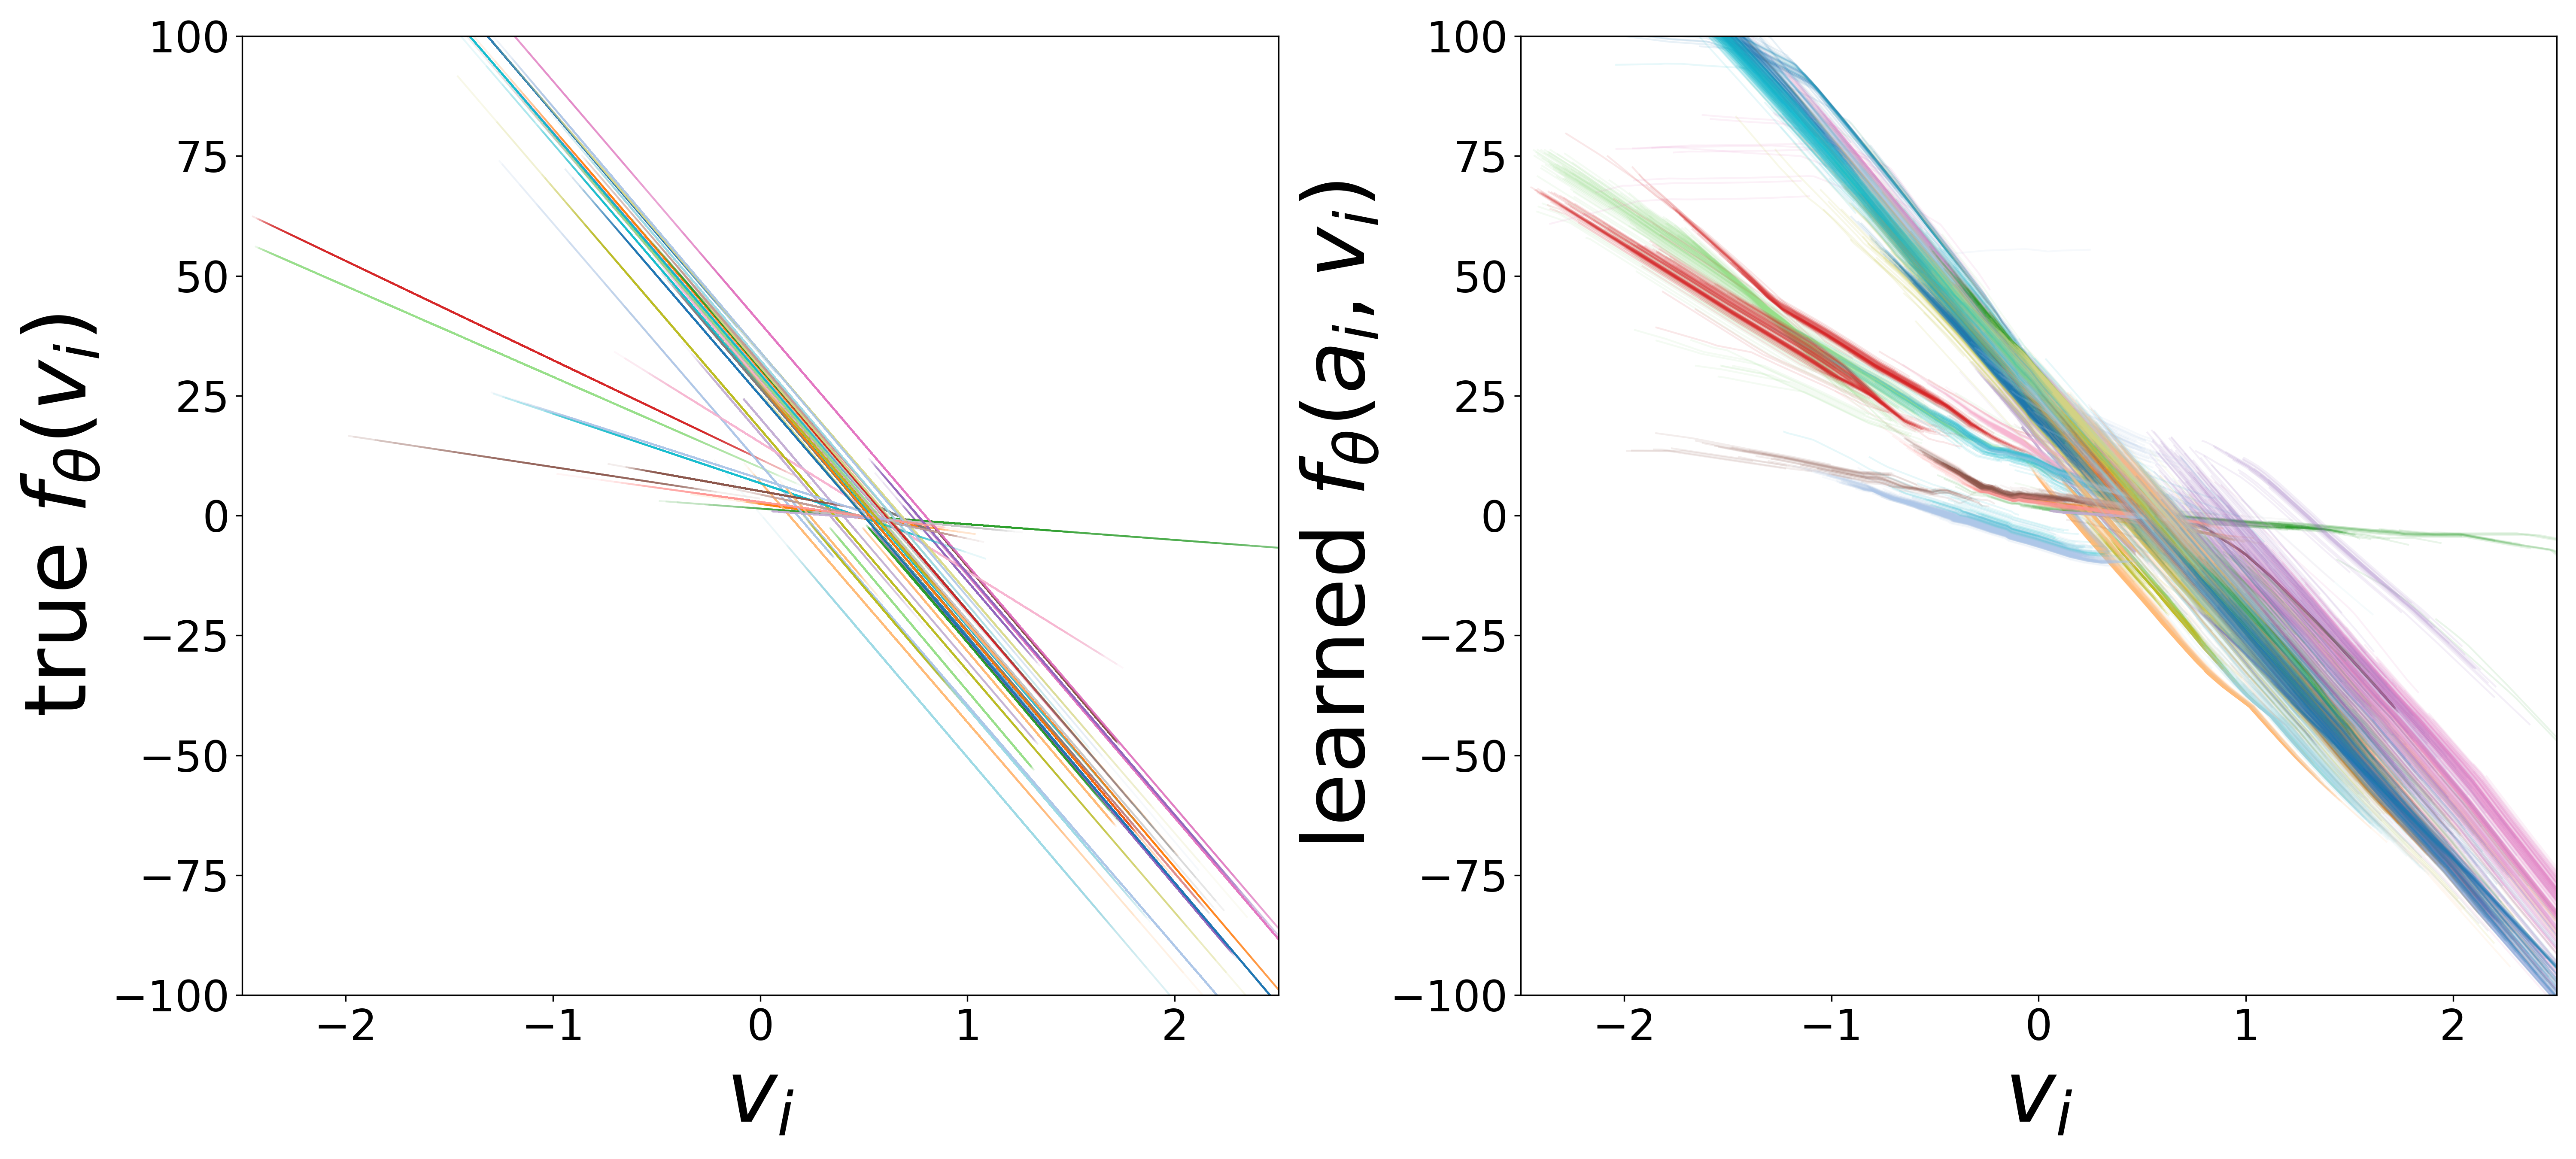
20% edges removed (86,822 removed / 347,290 remaining)
Time Constants (\(\tau\))
2% edges removed (8,682 removed / 425,430 remaining)
5% edges removed (21,706 removed / 412,406 remaining)
10% edges removed (43,411 removed / 390,701 remaining)
20% edges removed (86,822 removed / 347,290 remaining)
Resting Potentials (\(V^{\text{rest}}\))
2% edges removed (8,682 removed / 425,430 remaining)
5% edges removed (21,706 removed / 412,406 remaining)
10% edges removed (43,411 removed / 390,701 remaining)
20% edges removed (86,822 removed / 347,290 remaining)
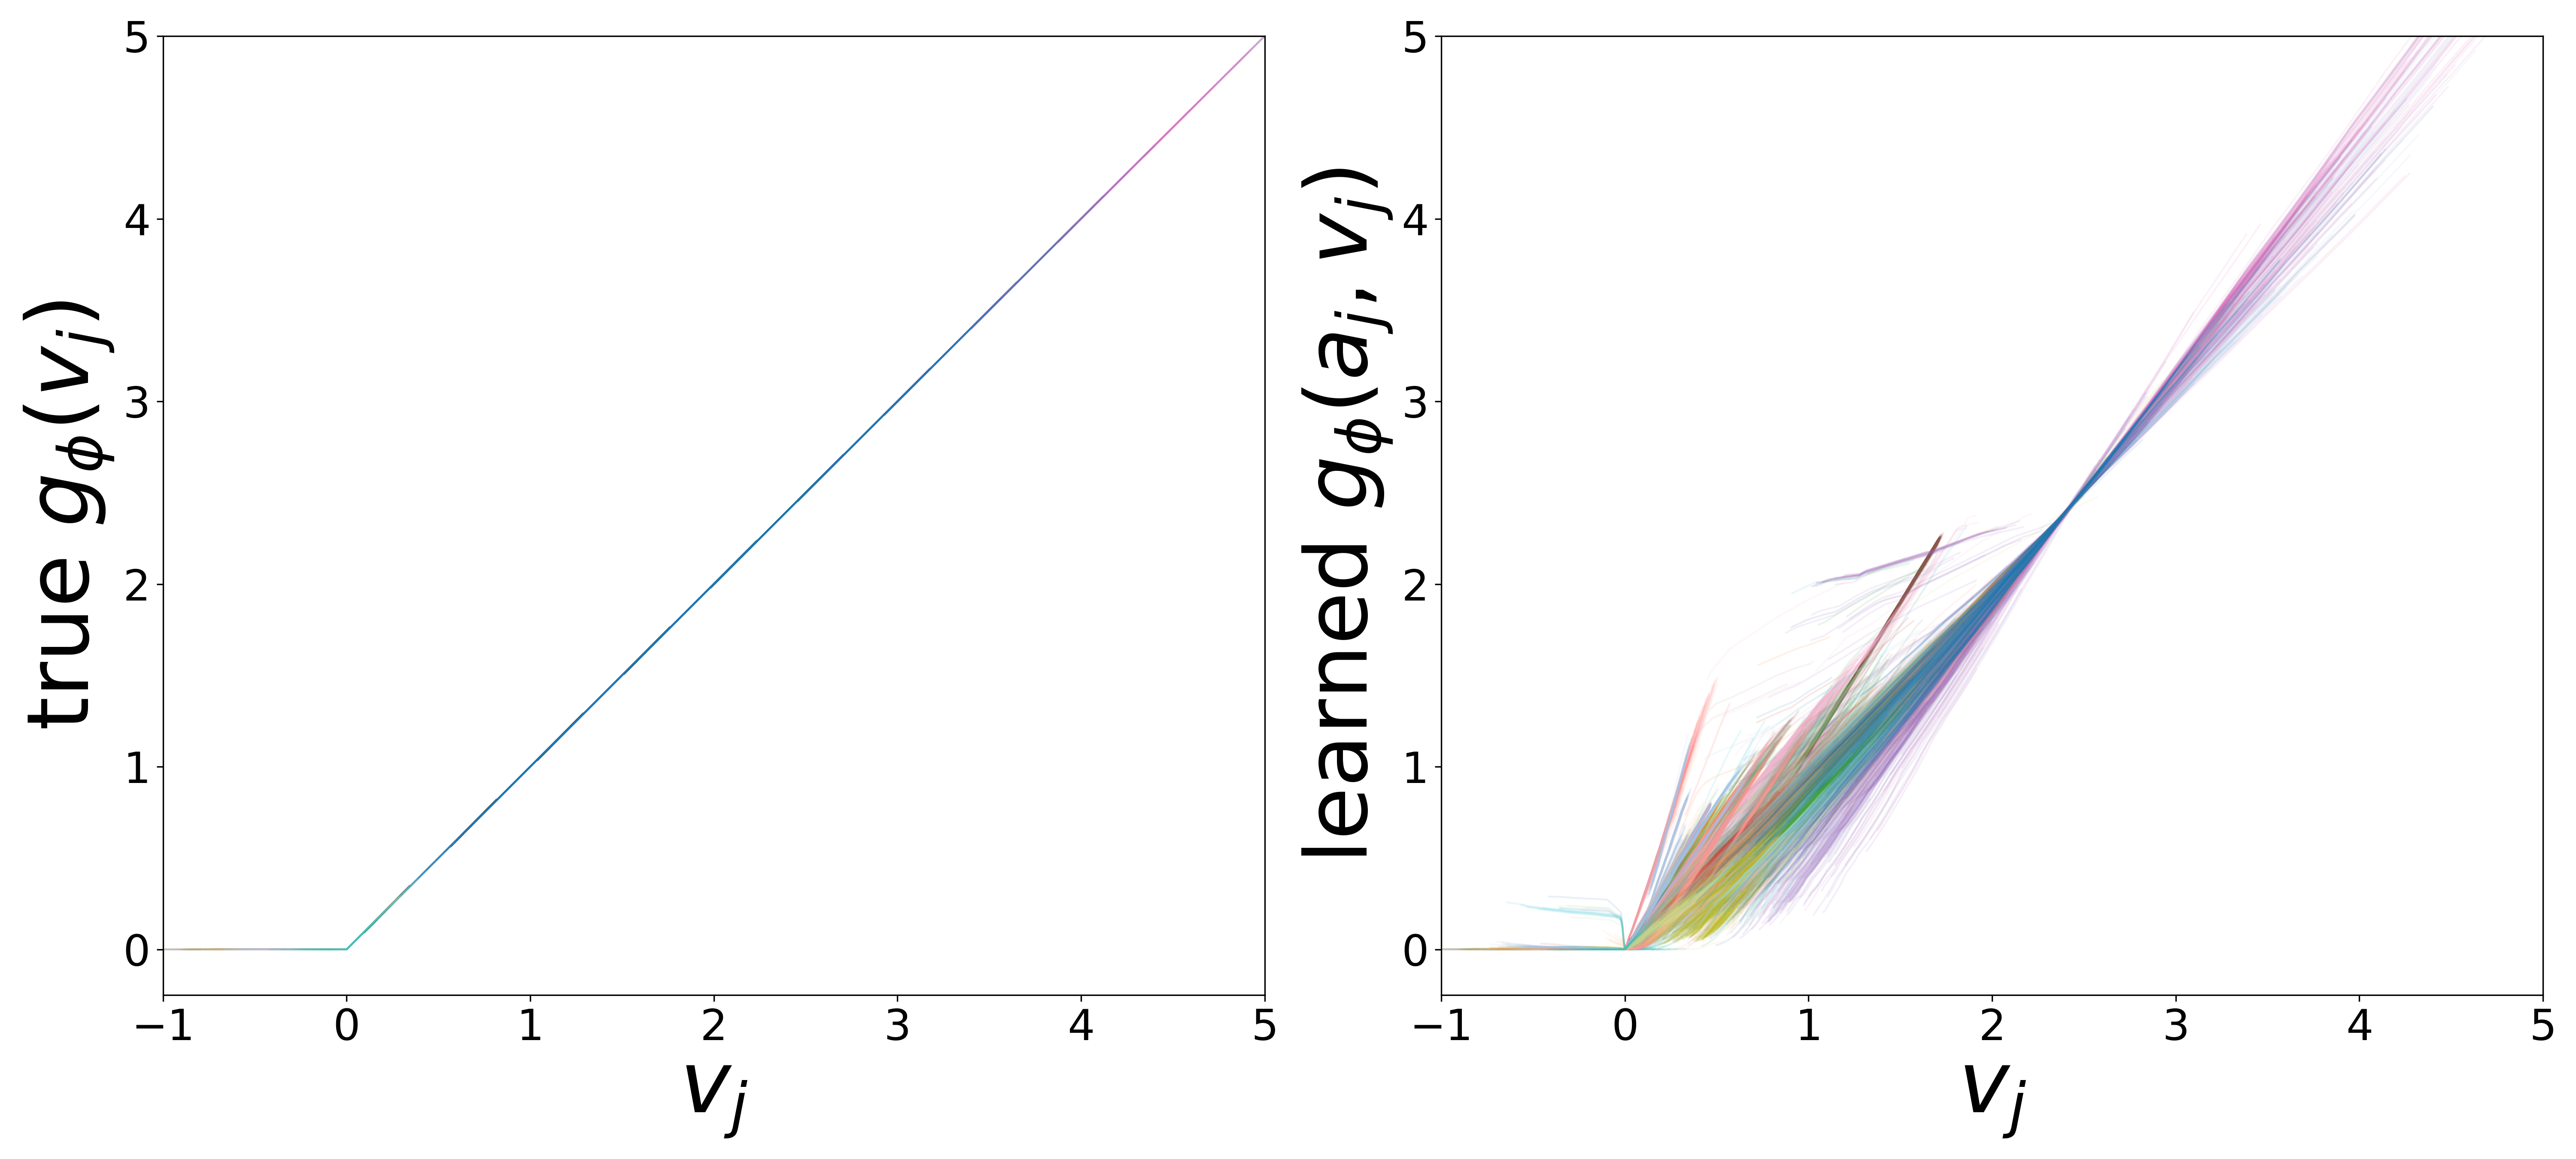
\(g_\phi\) (MLP\(_1\)): Edge Message Function
2% edges removed (8,682 removed / 425,430 remaining)
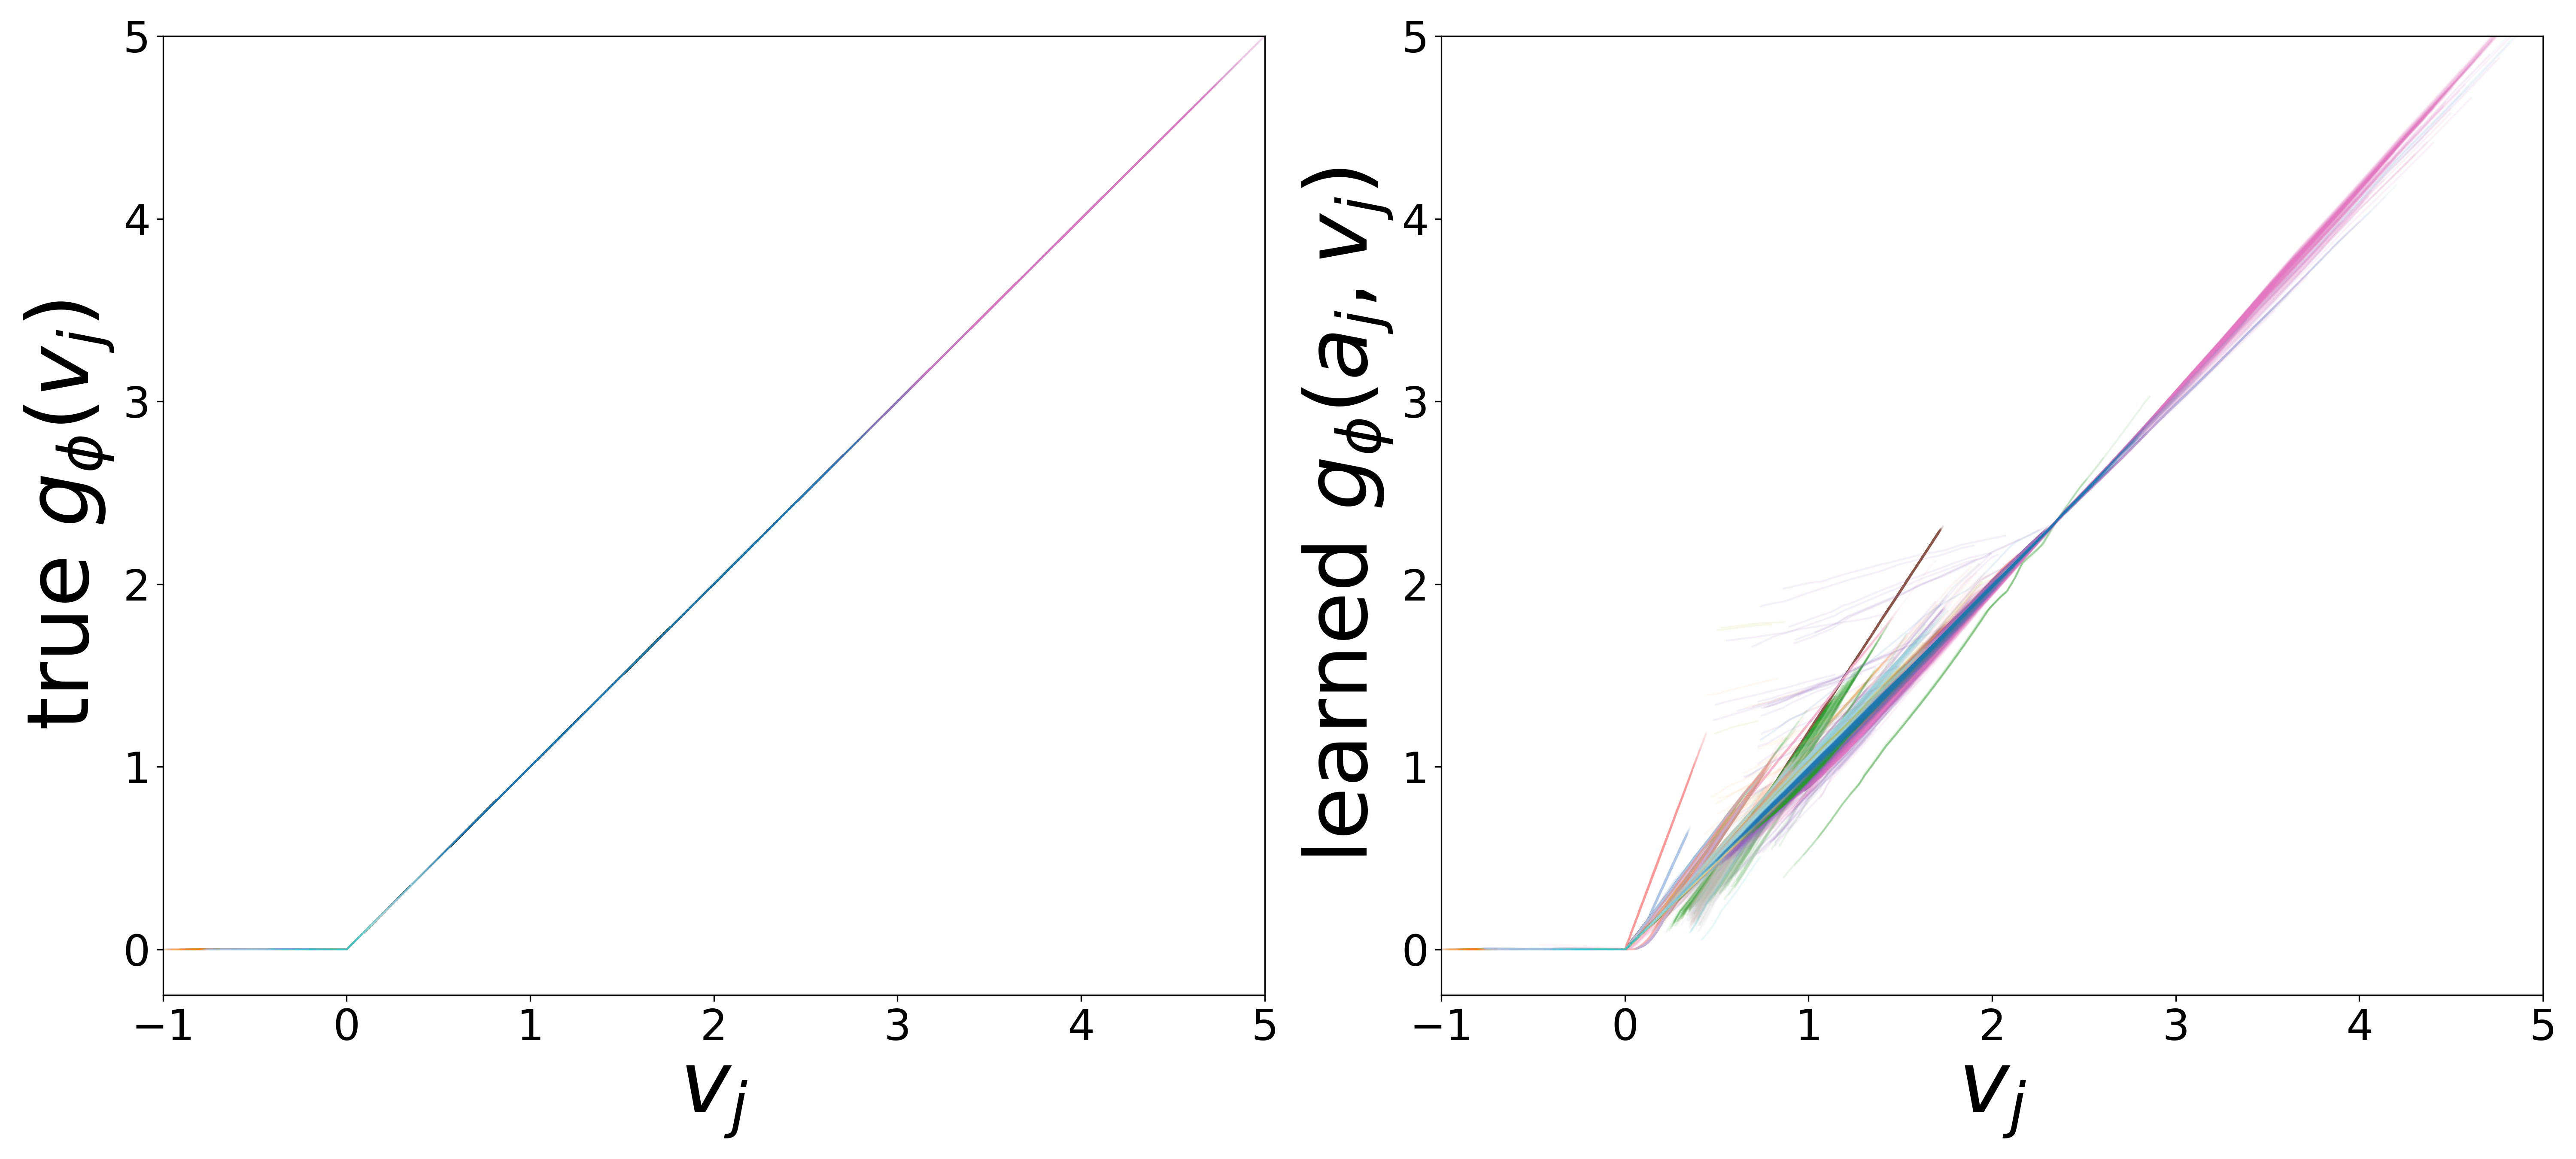
5% edges removed (21,706 removed / 412,406 remaining)
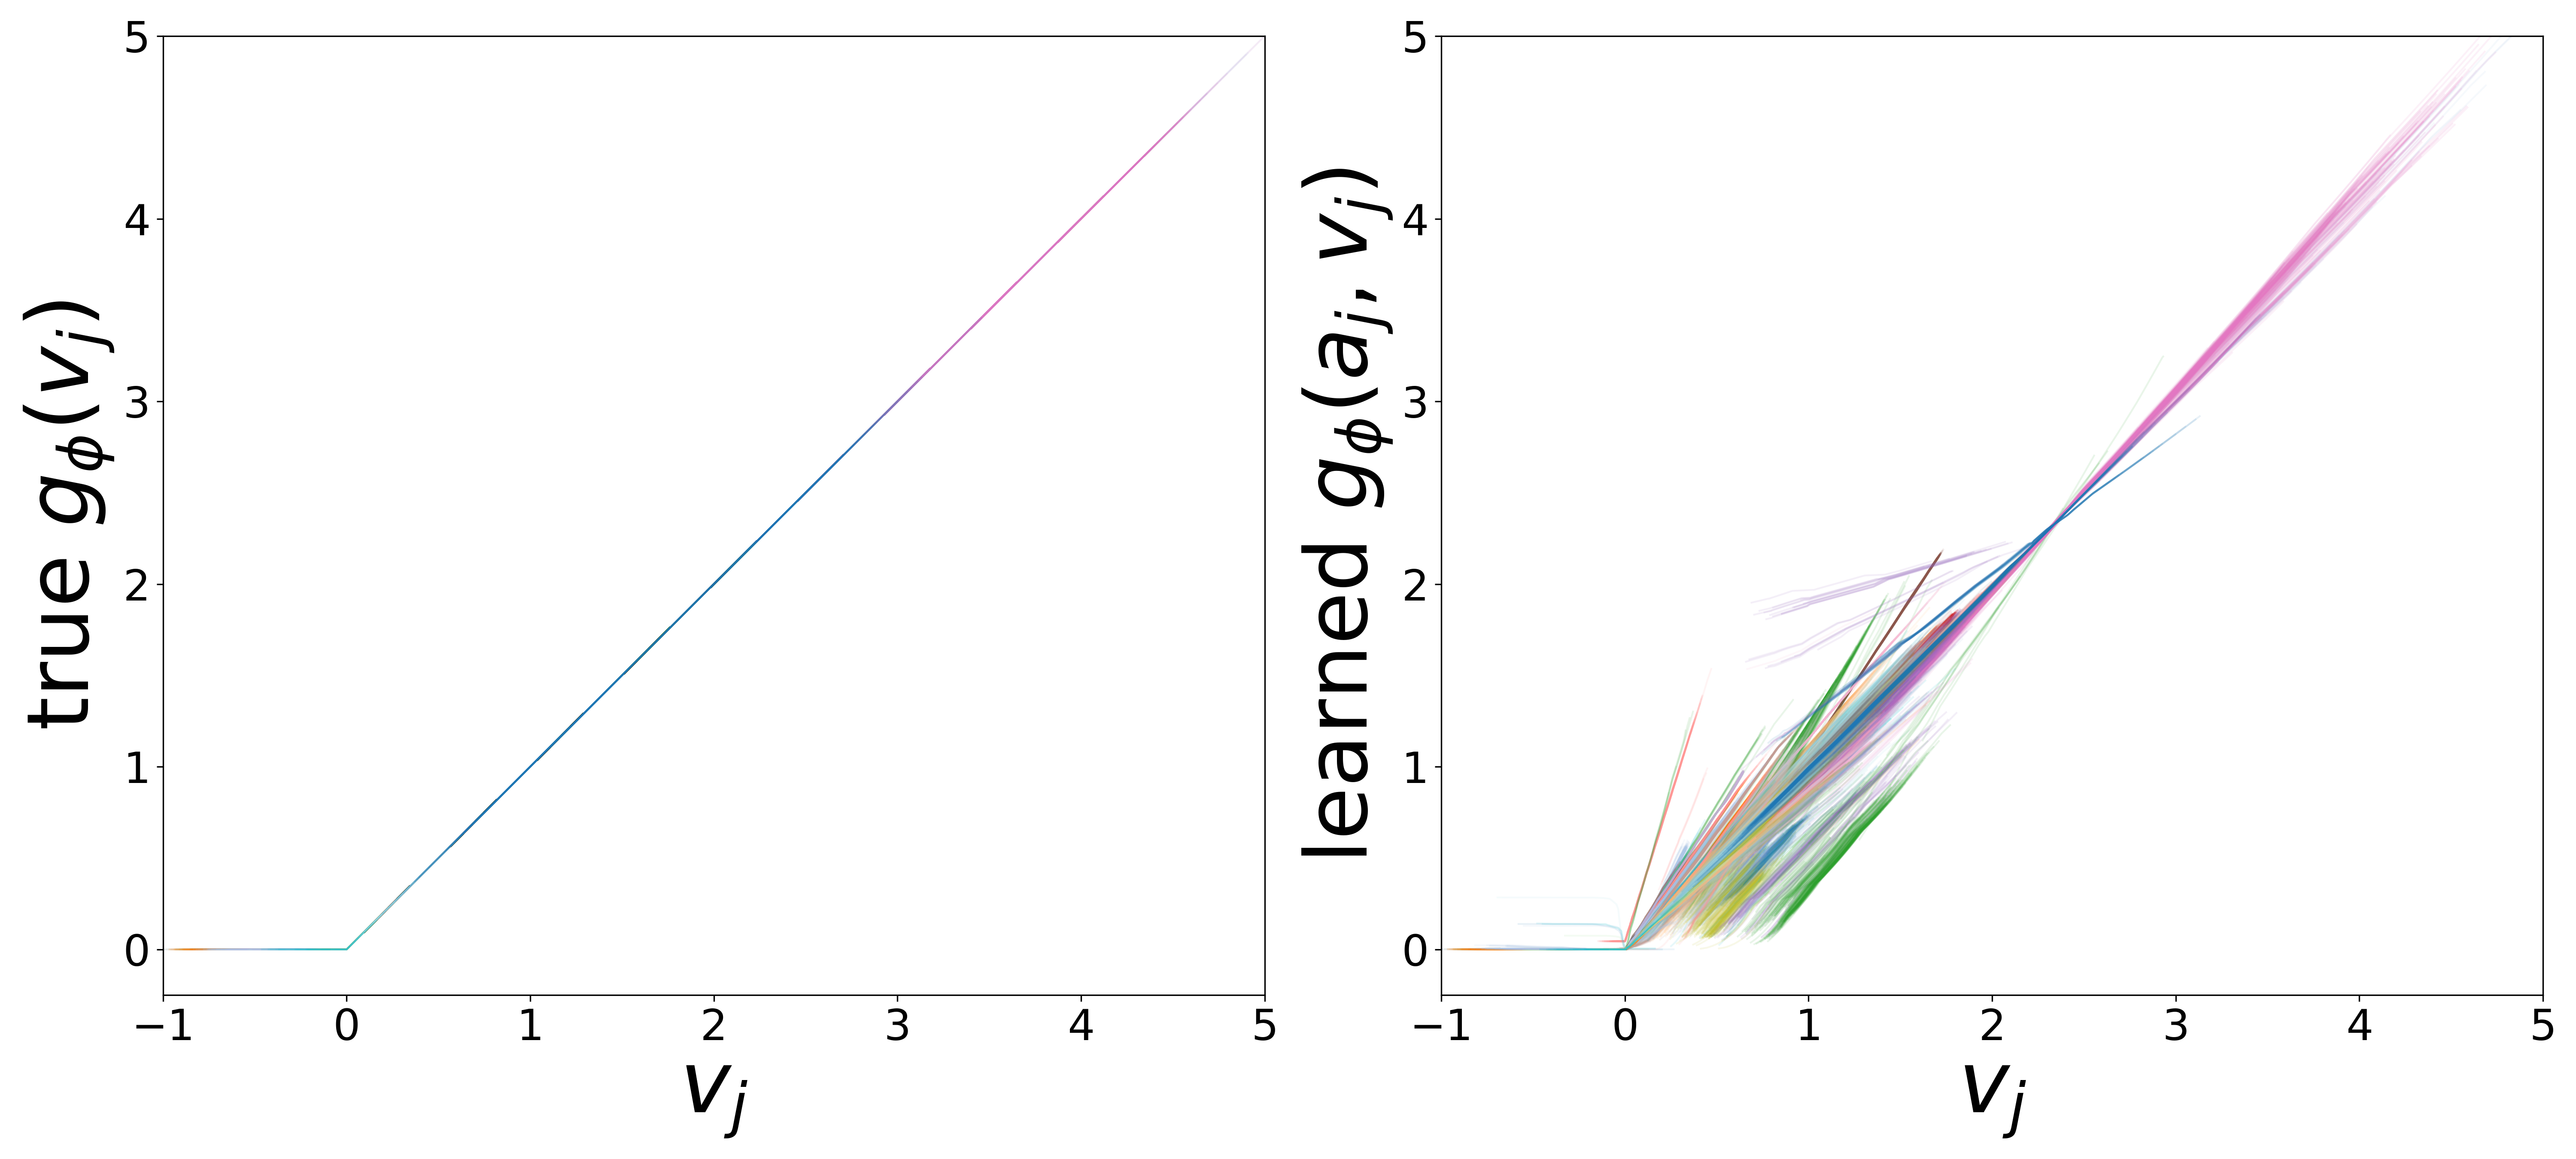
10% edges removed (43,411 removed / 390,701 remaining)
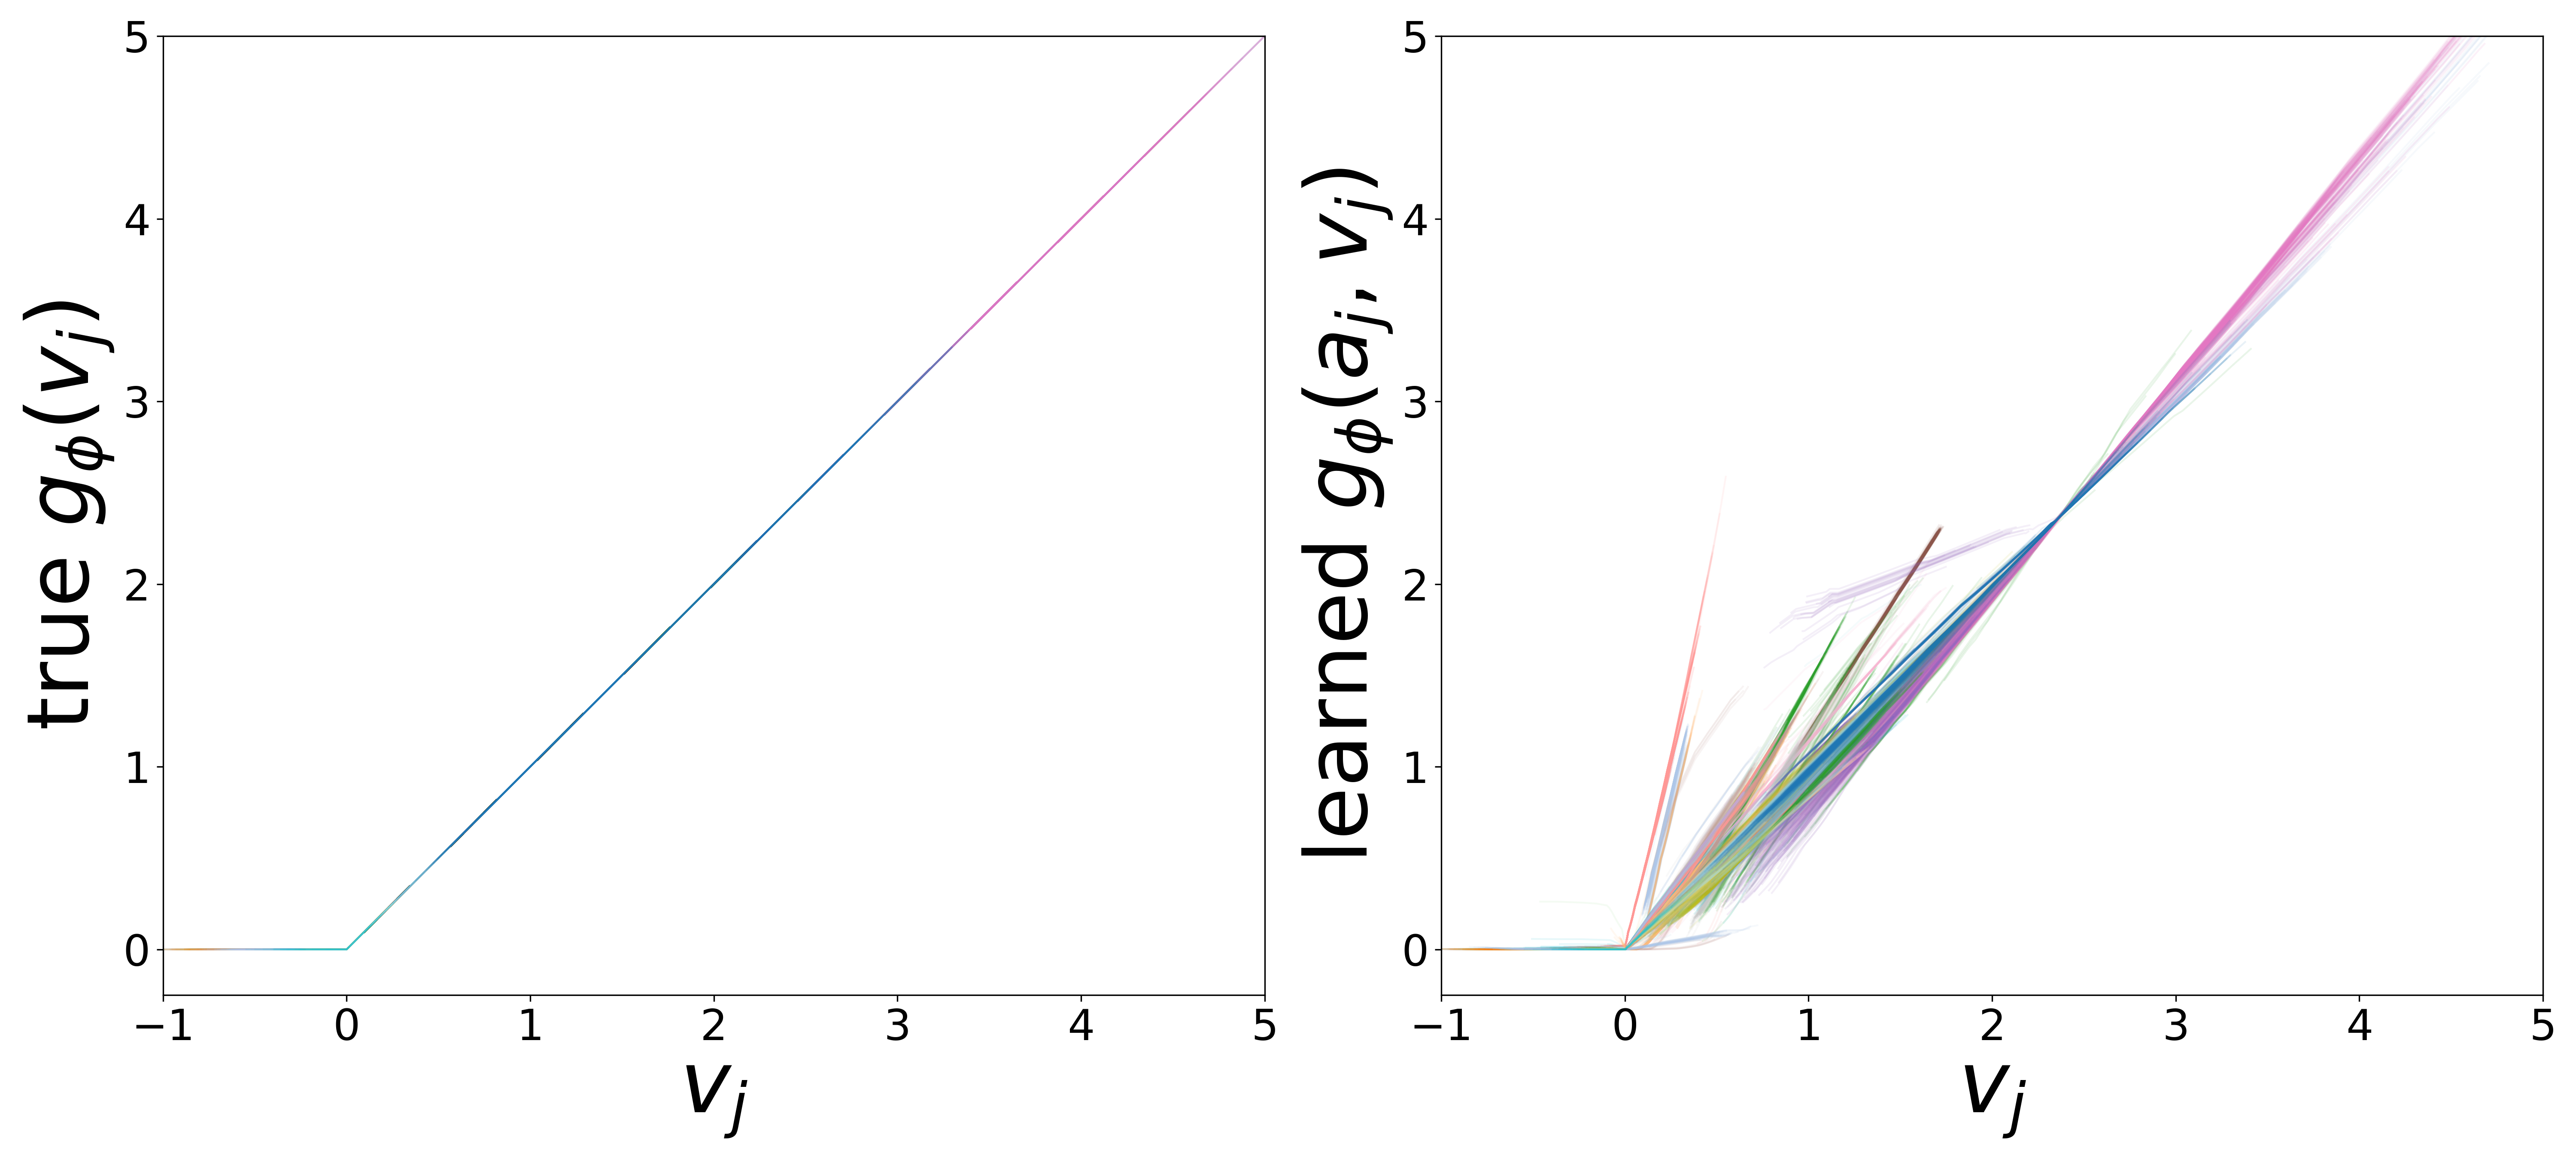
20% edges removed (86,822 removed / 347,290 remaining)
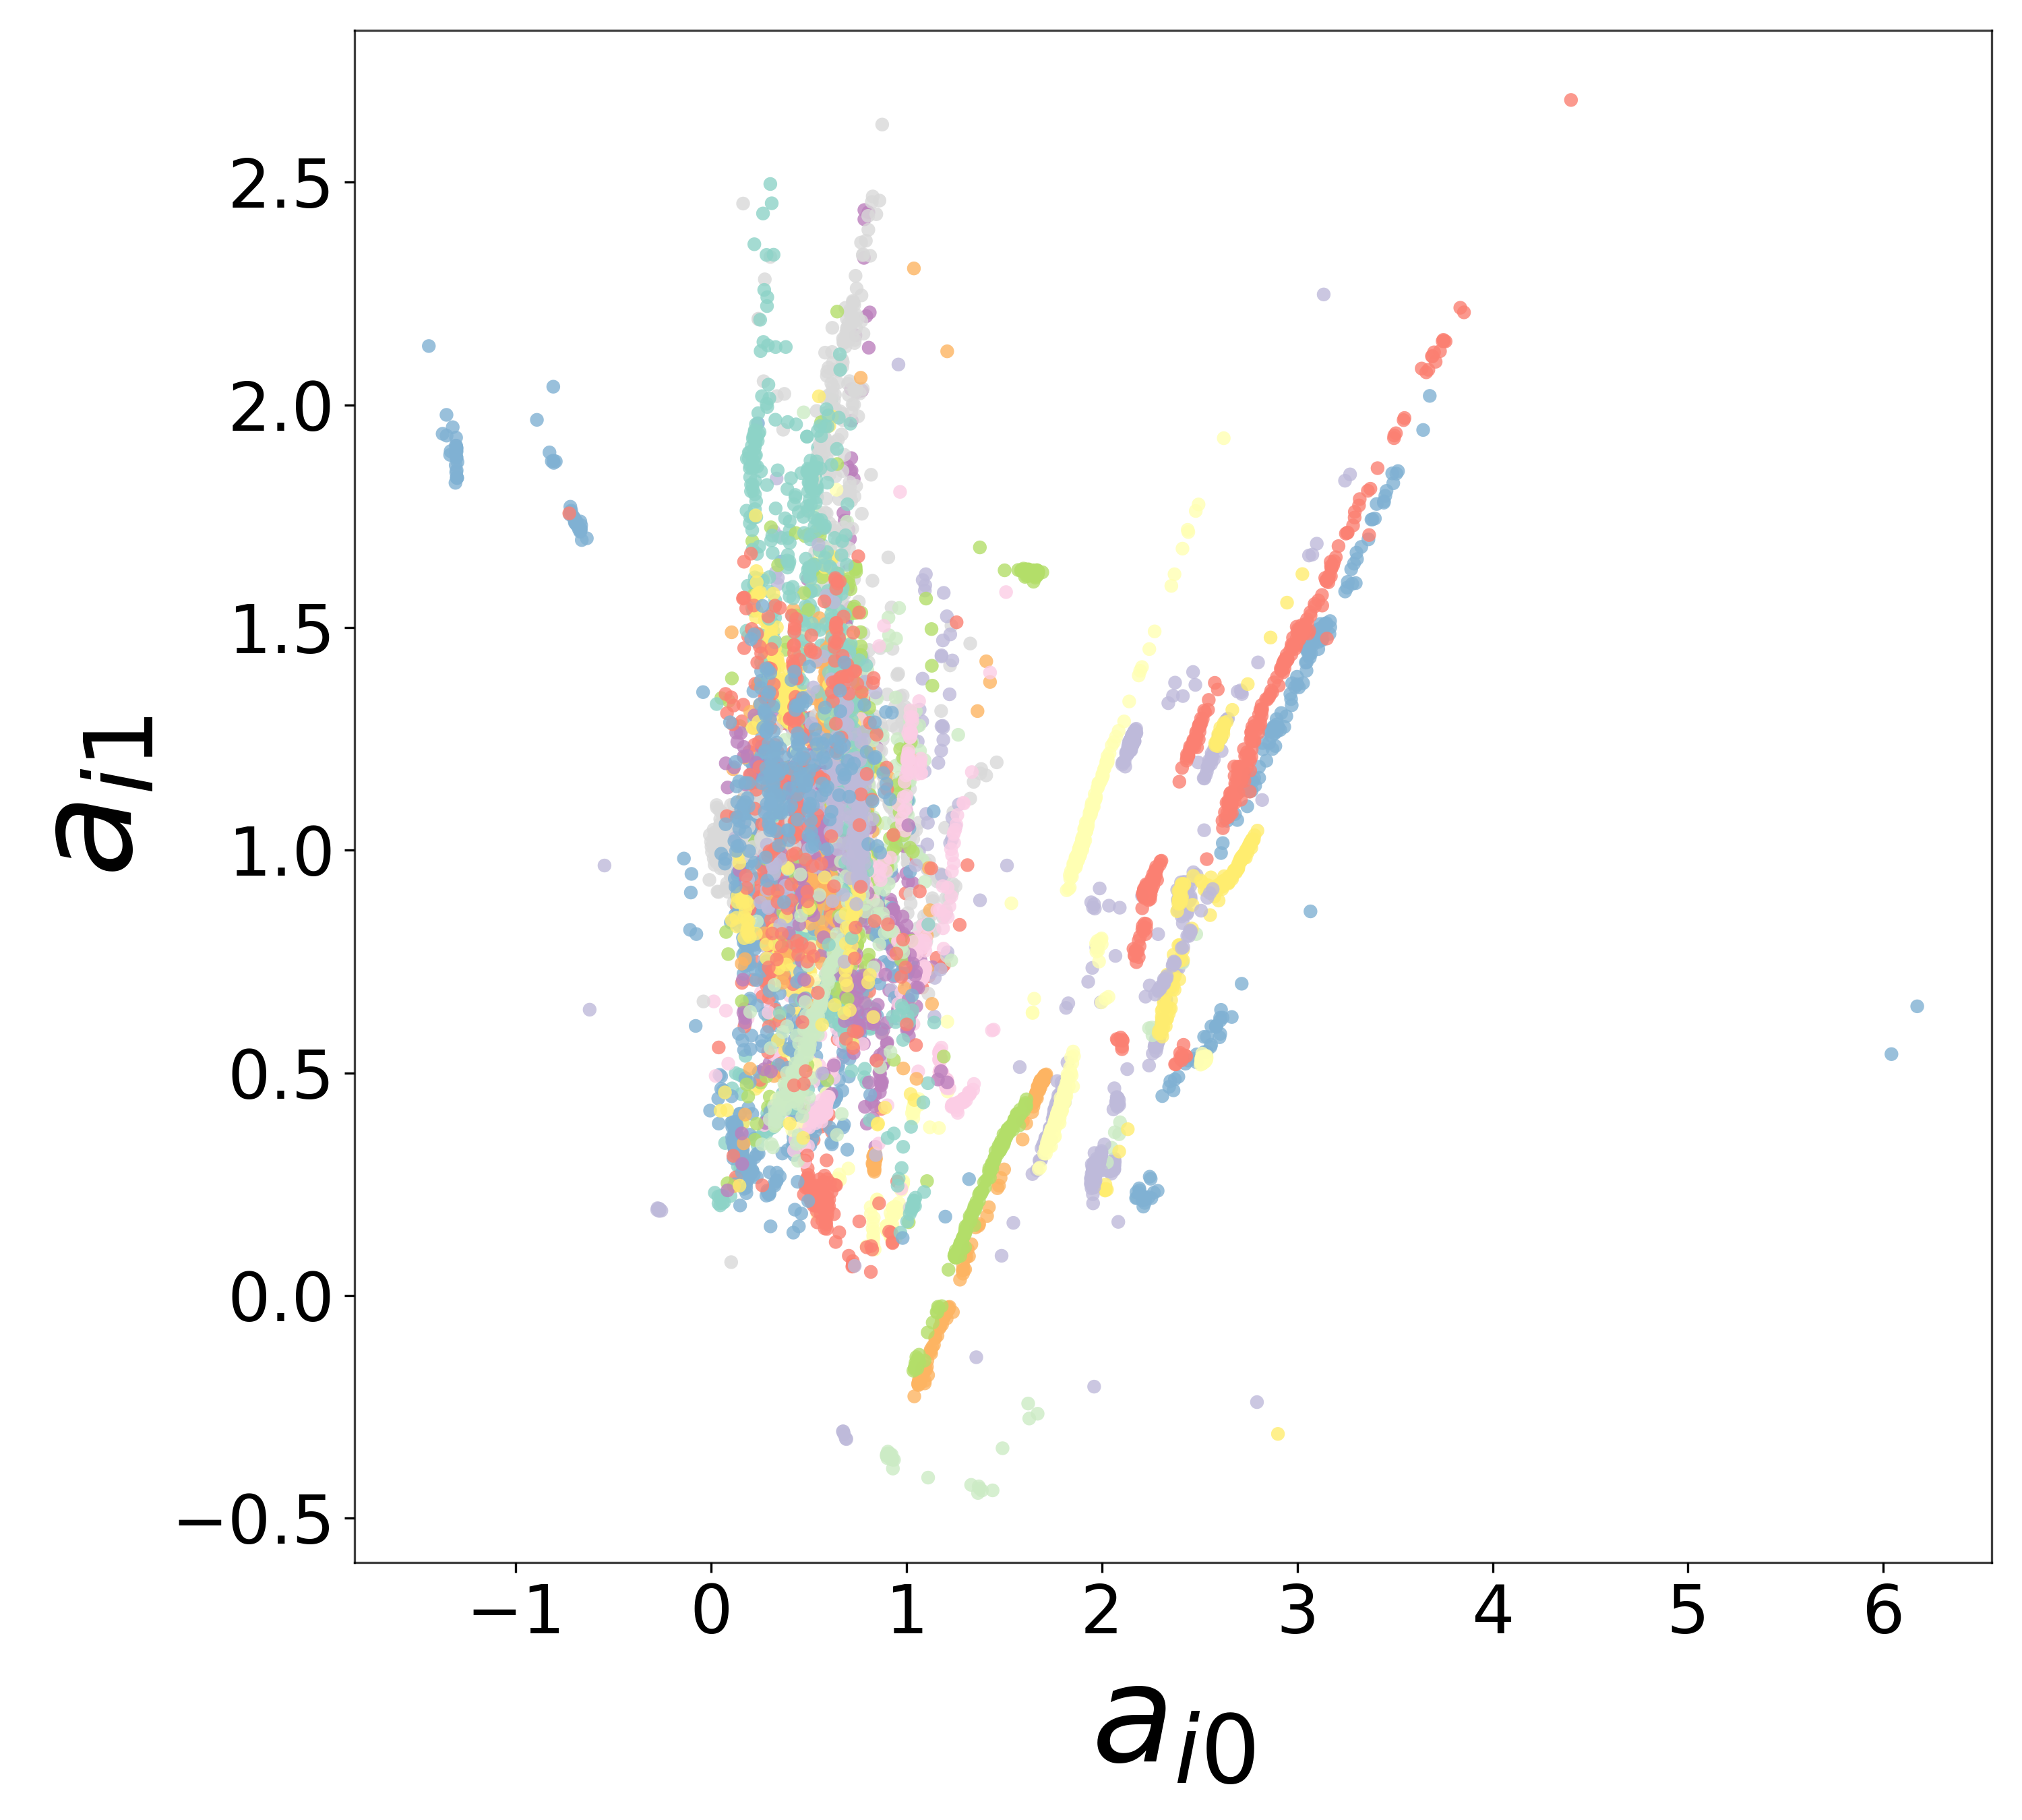
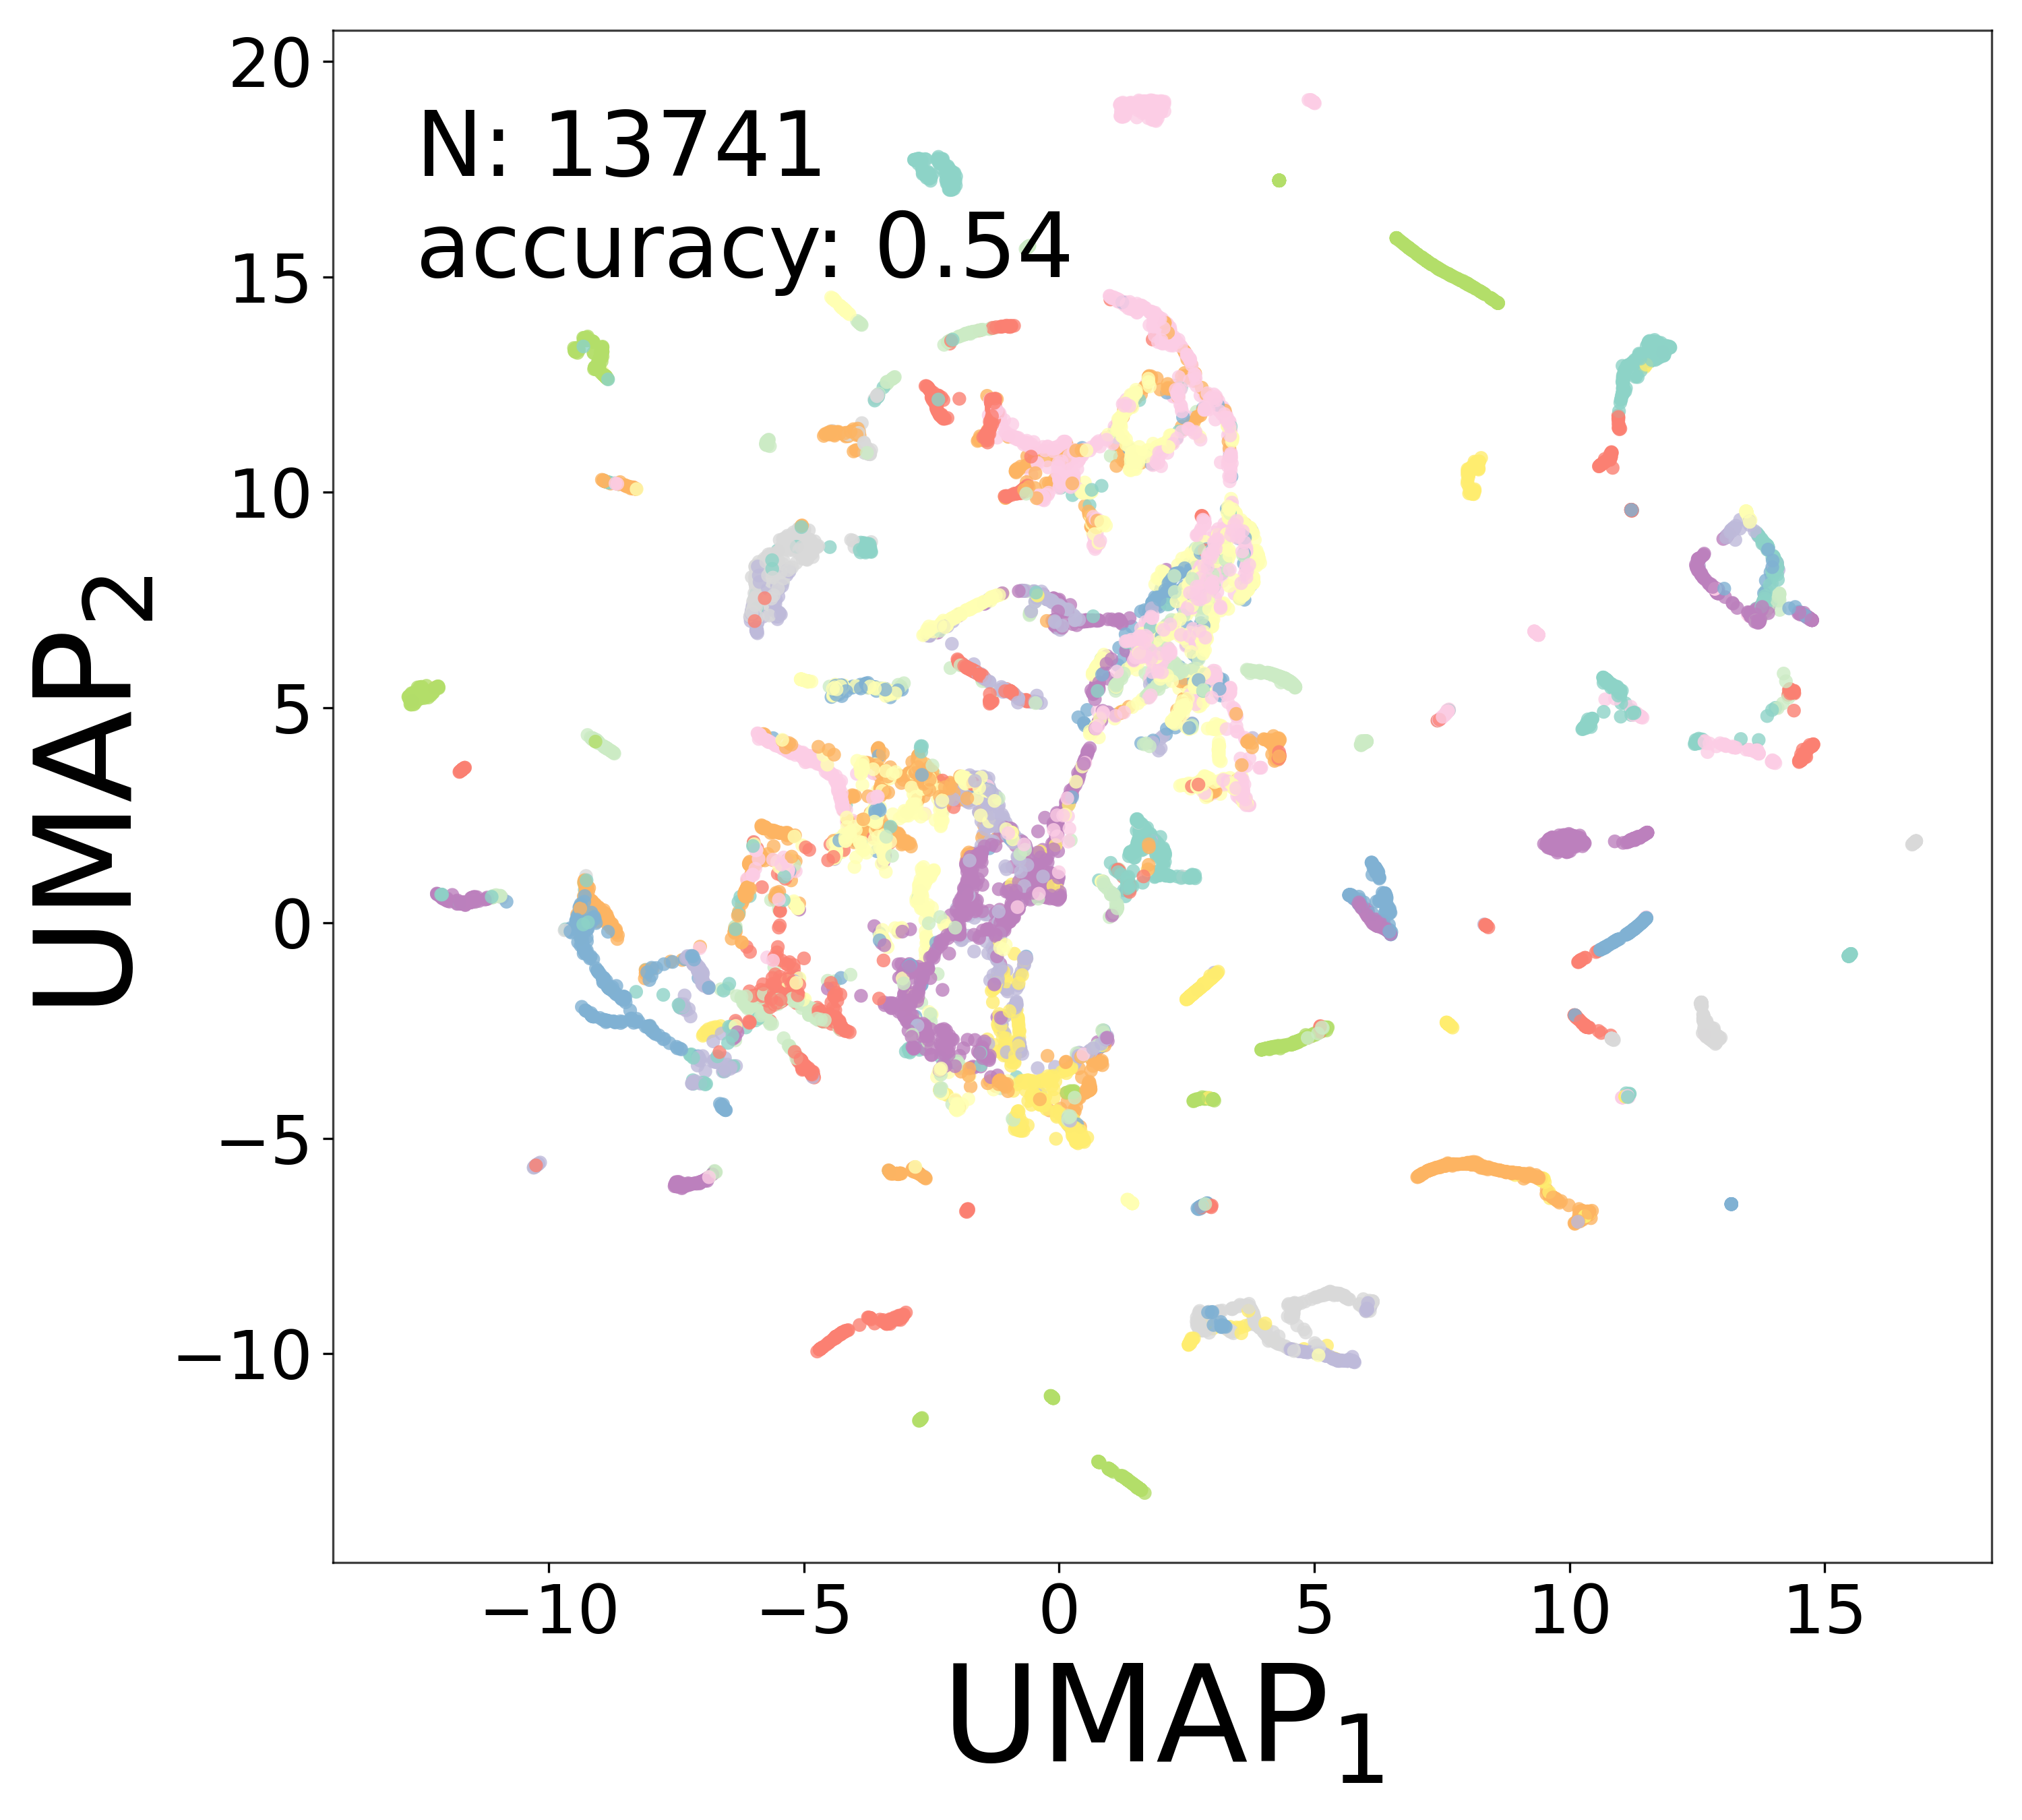
Neural Embeddings
2% edges removed (8,682 removed / 425,430 remaining)
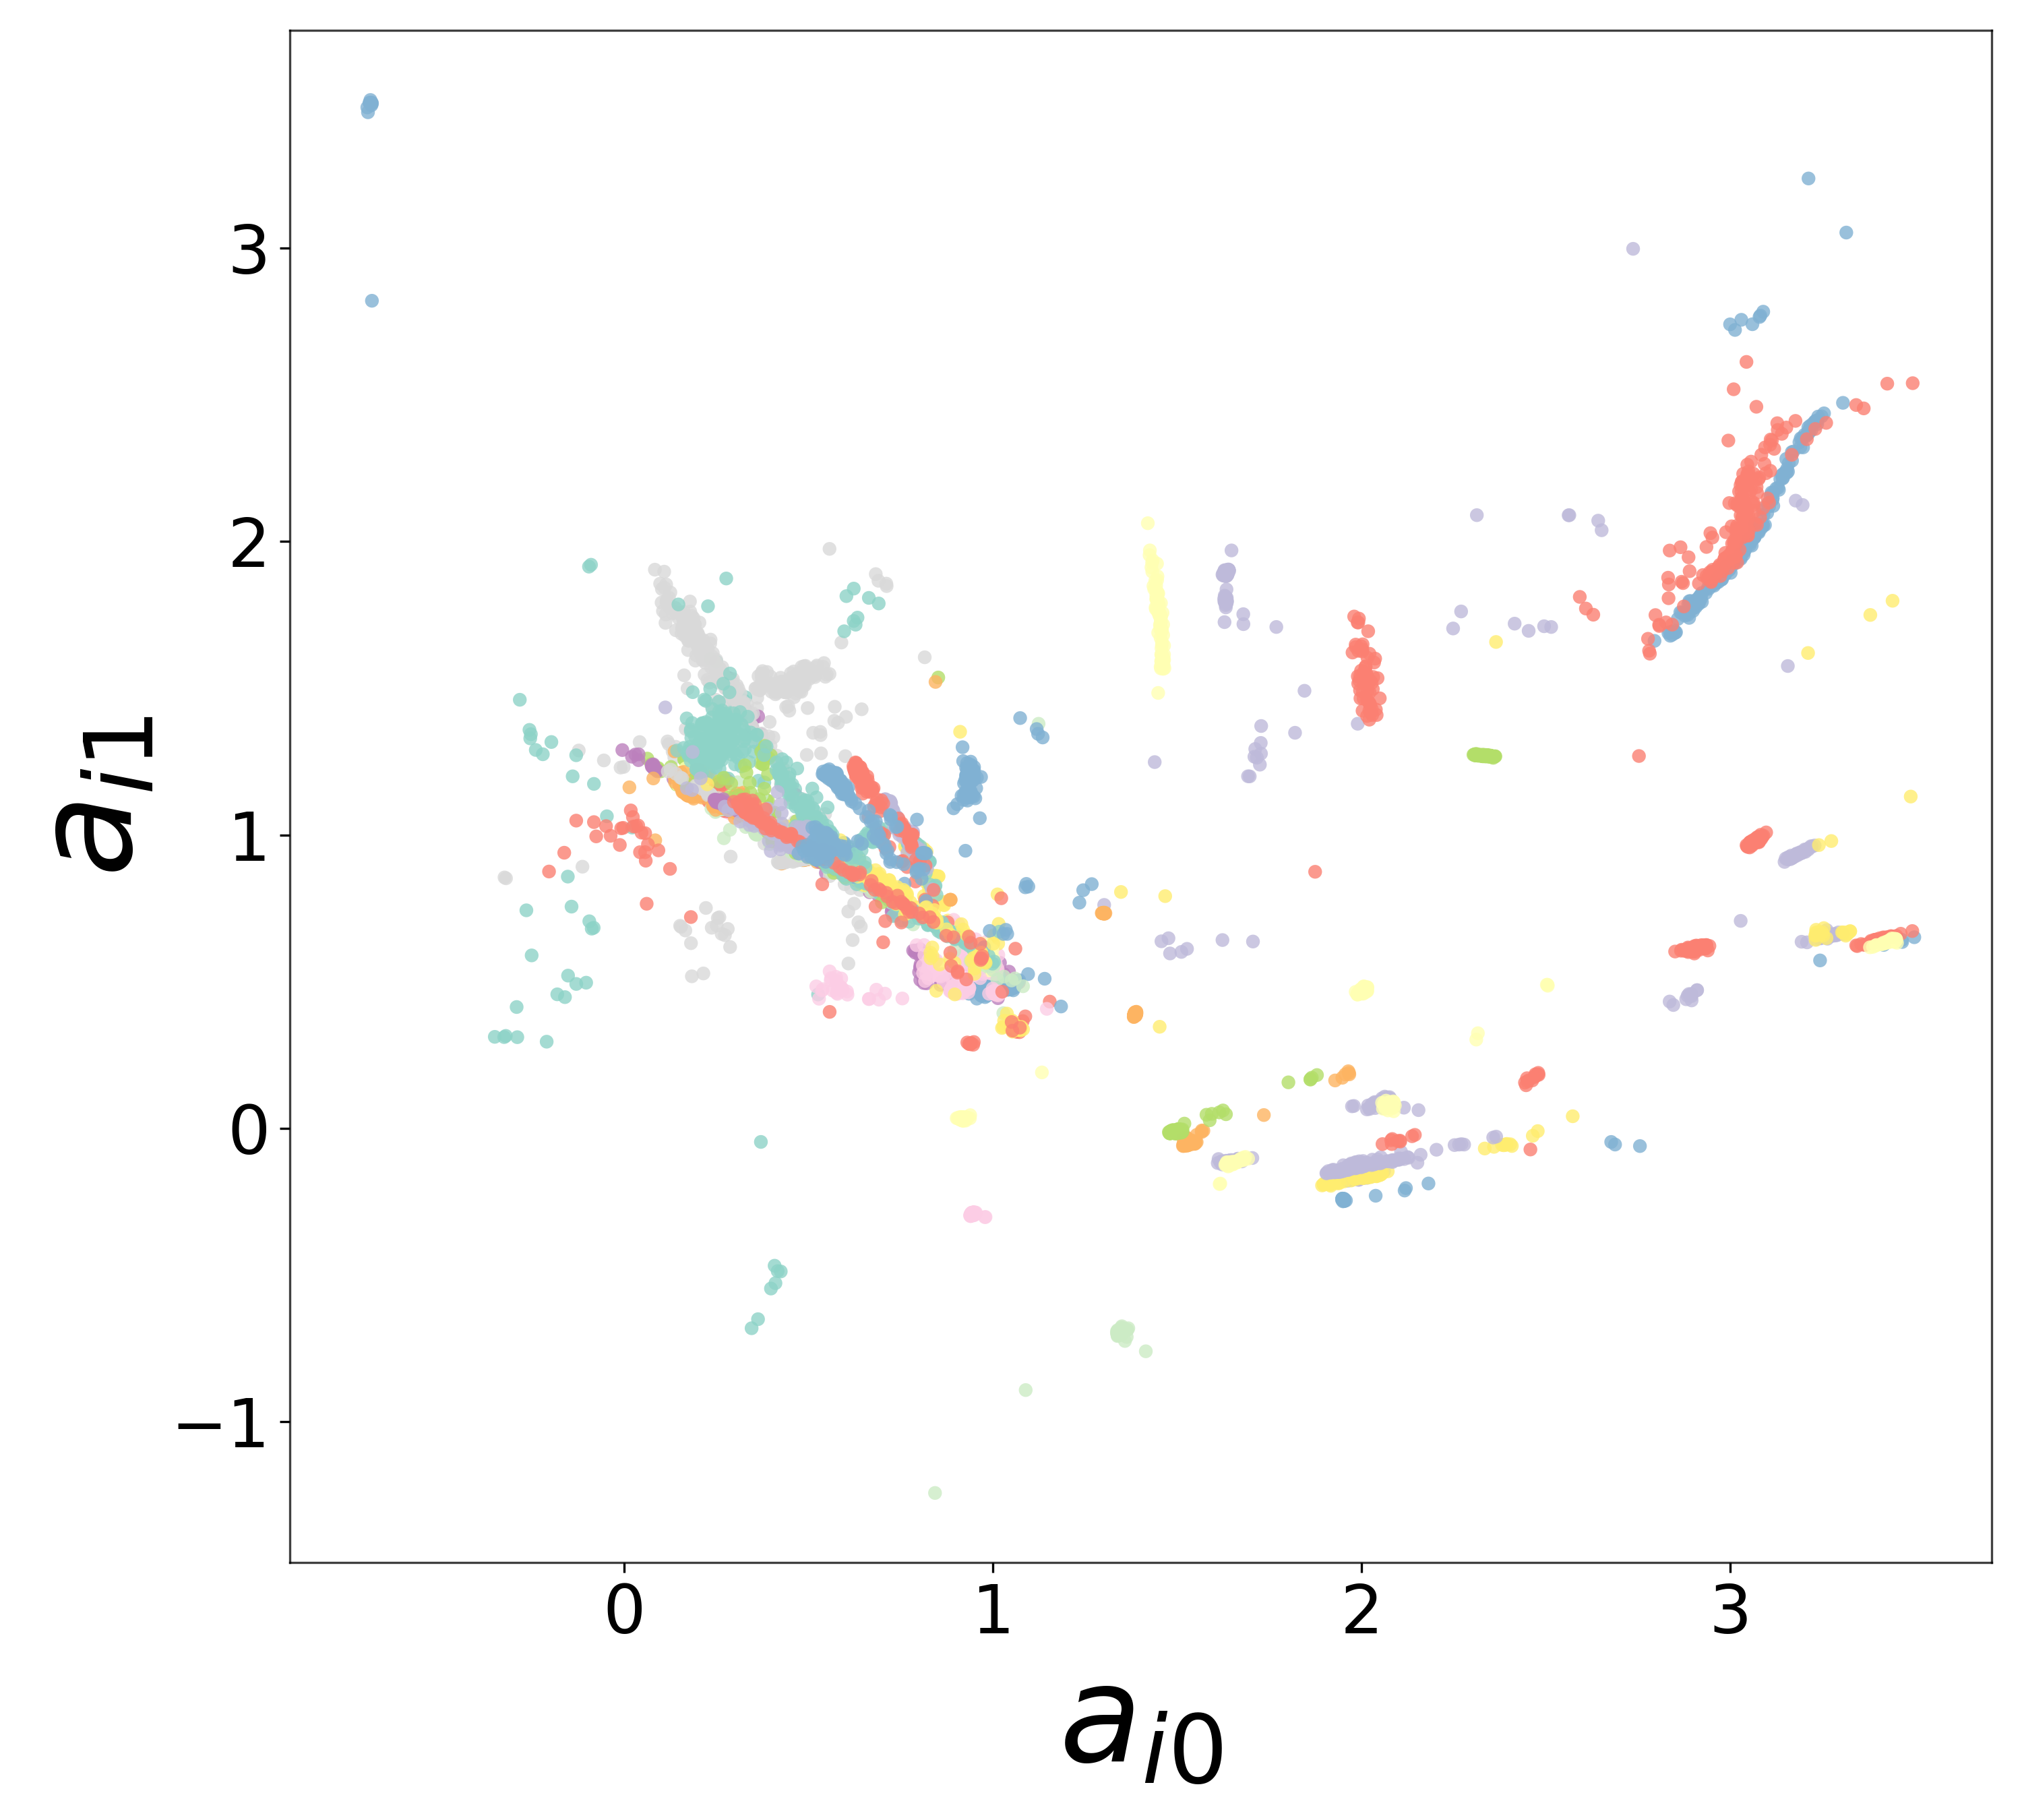
5% edges removed (21,706 removed / 412,406 remaining)
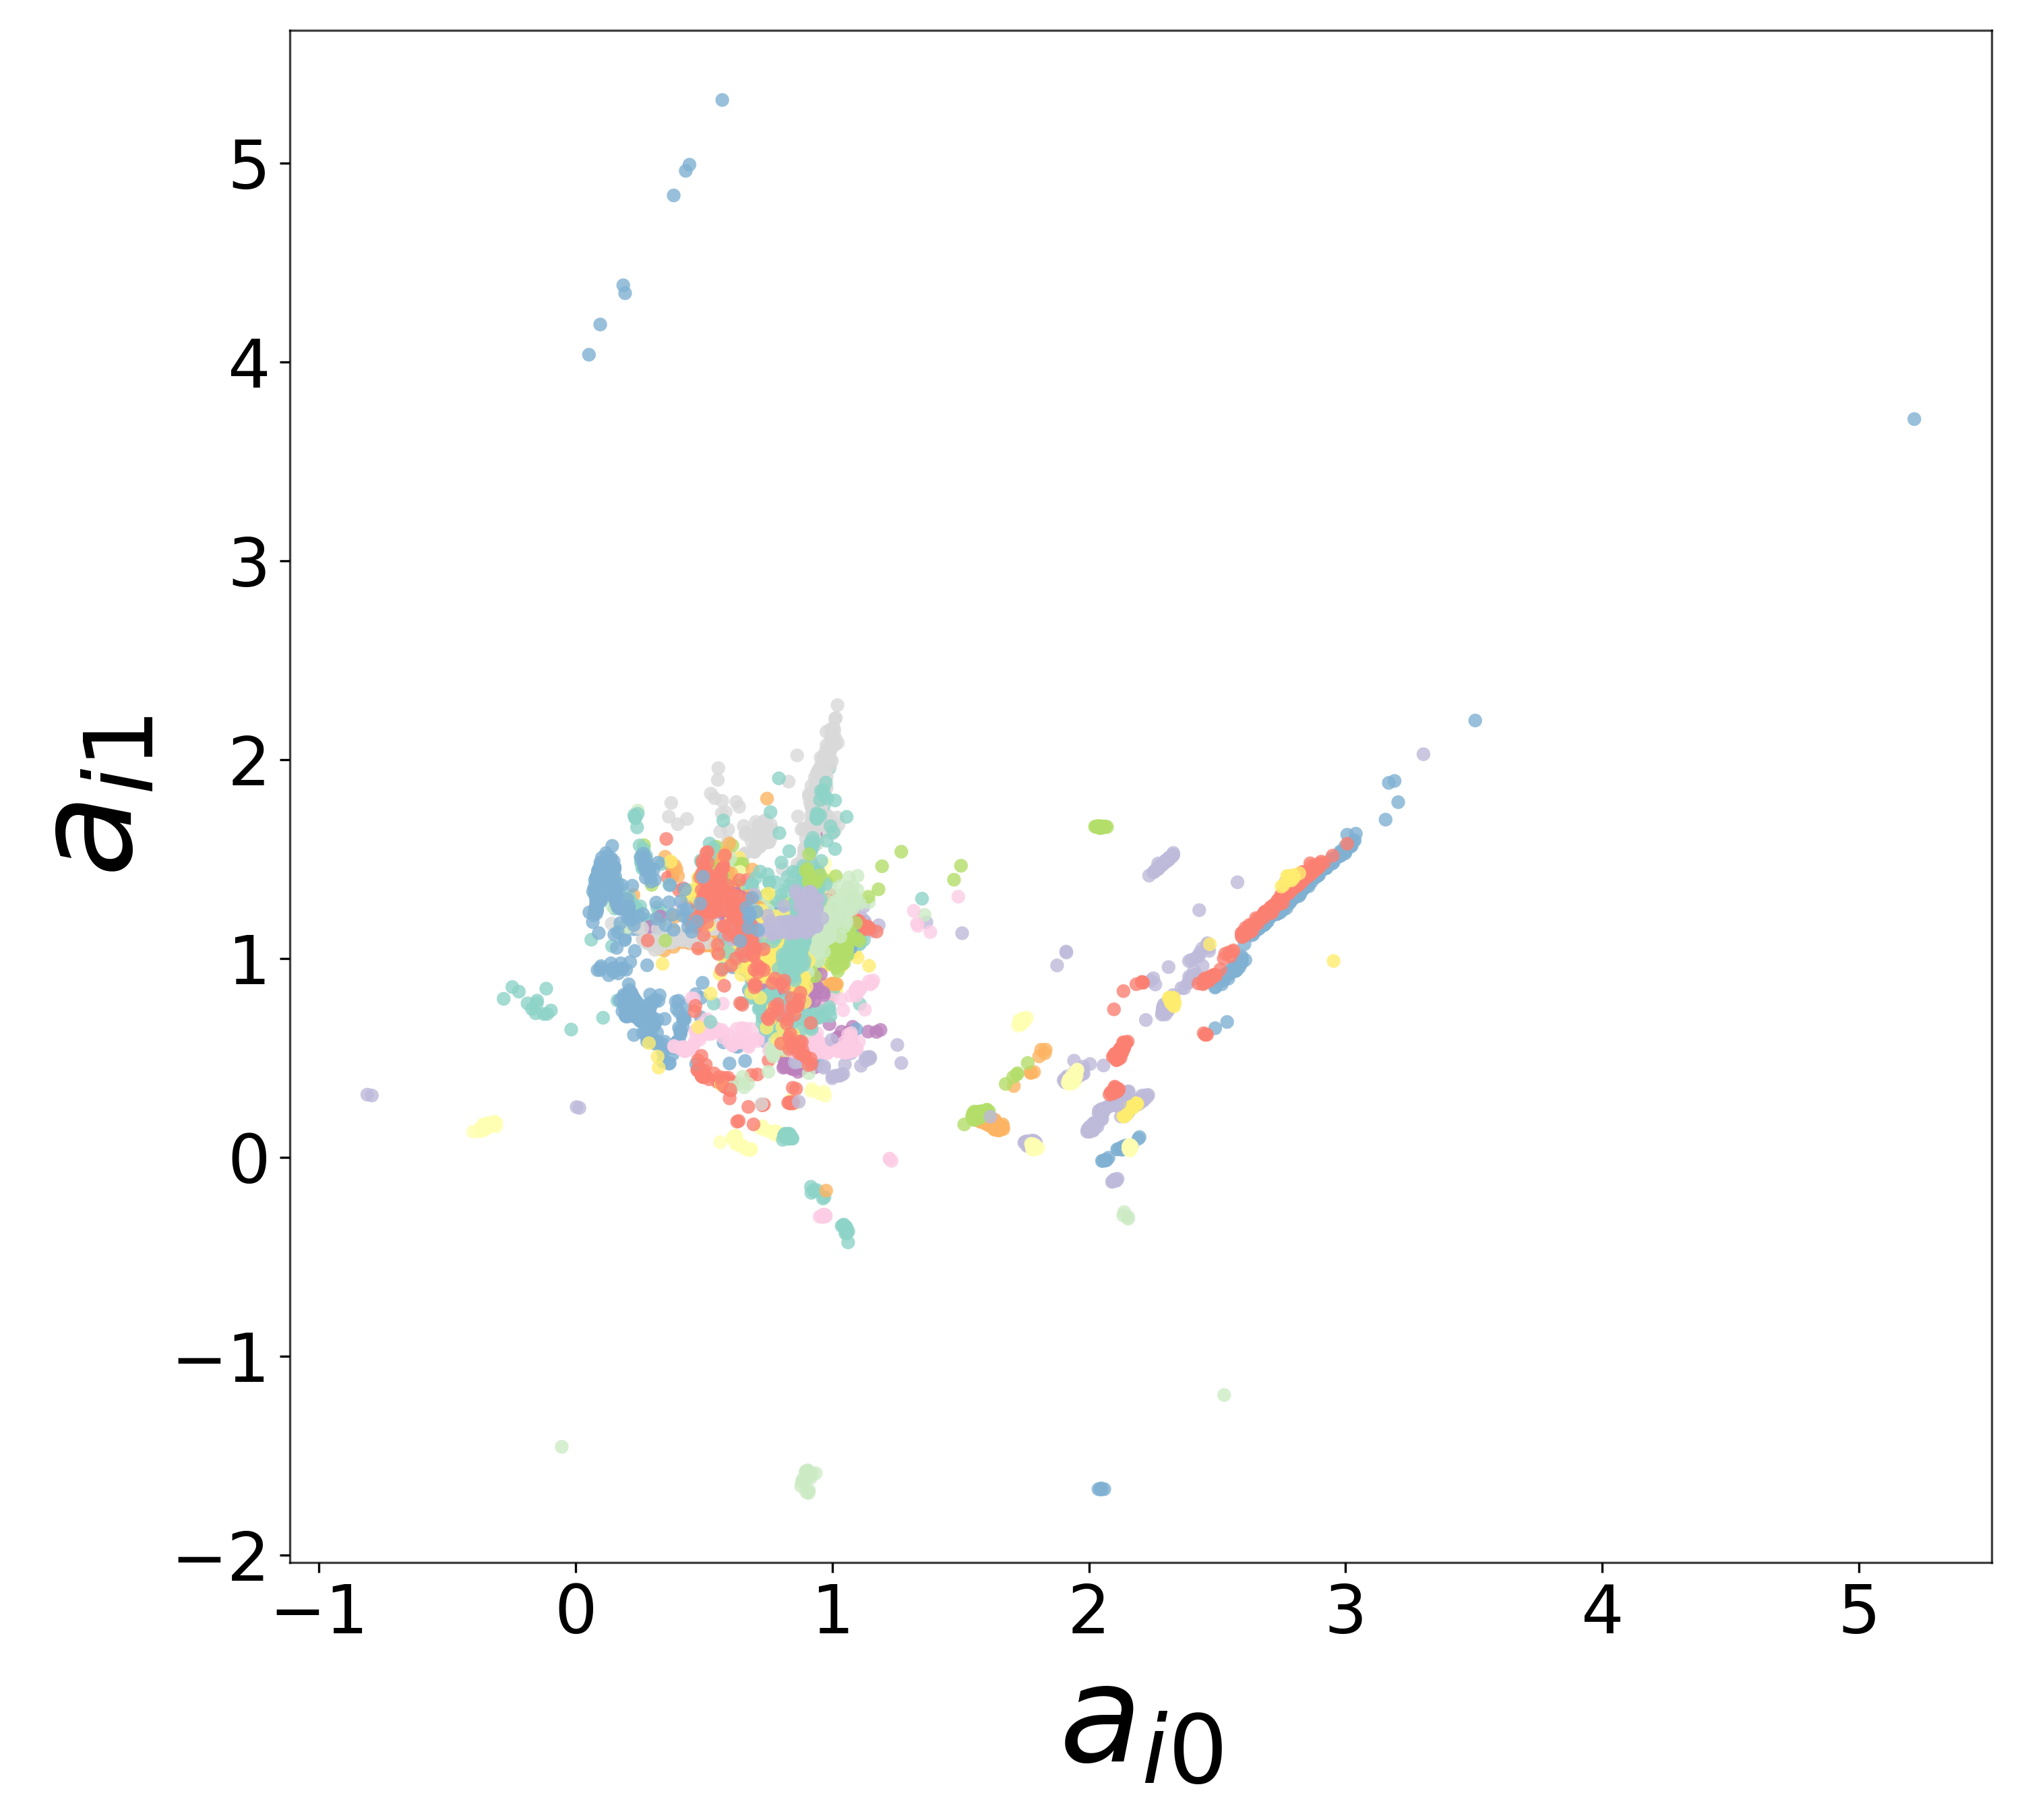
10% edges removed (43,411 removed / 390,701 remaining)
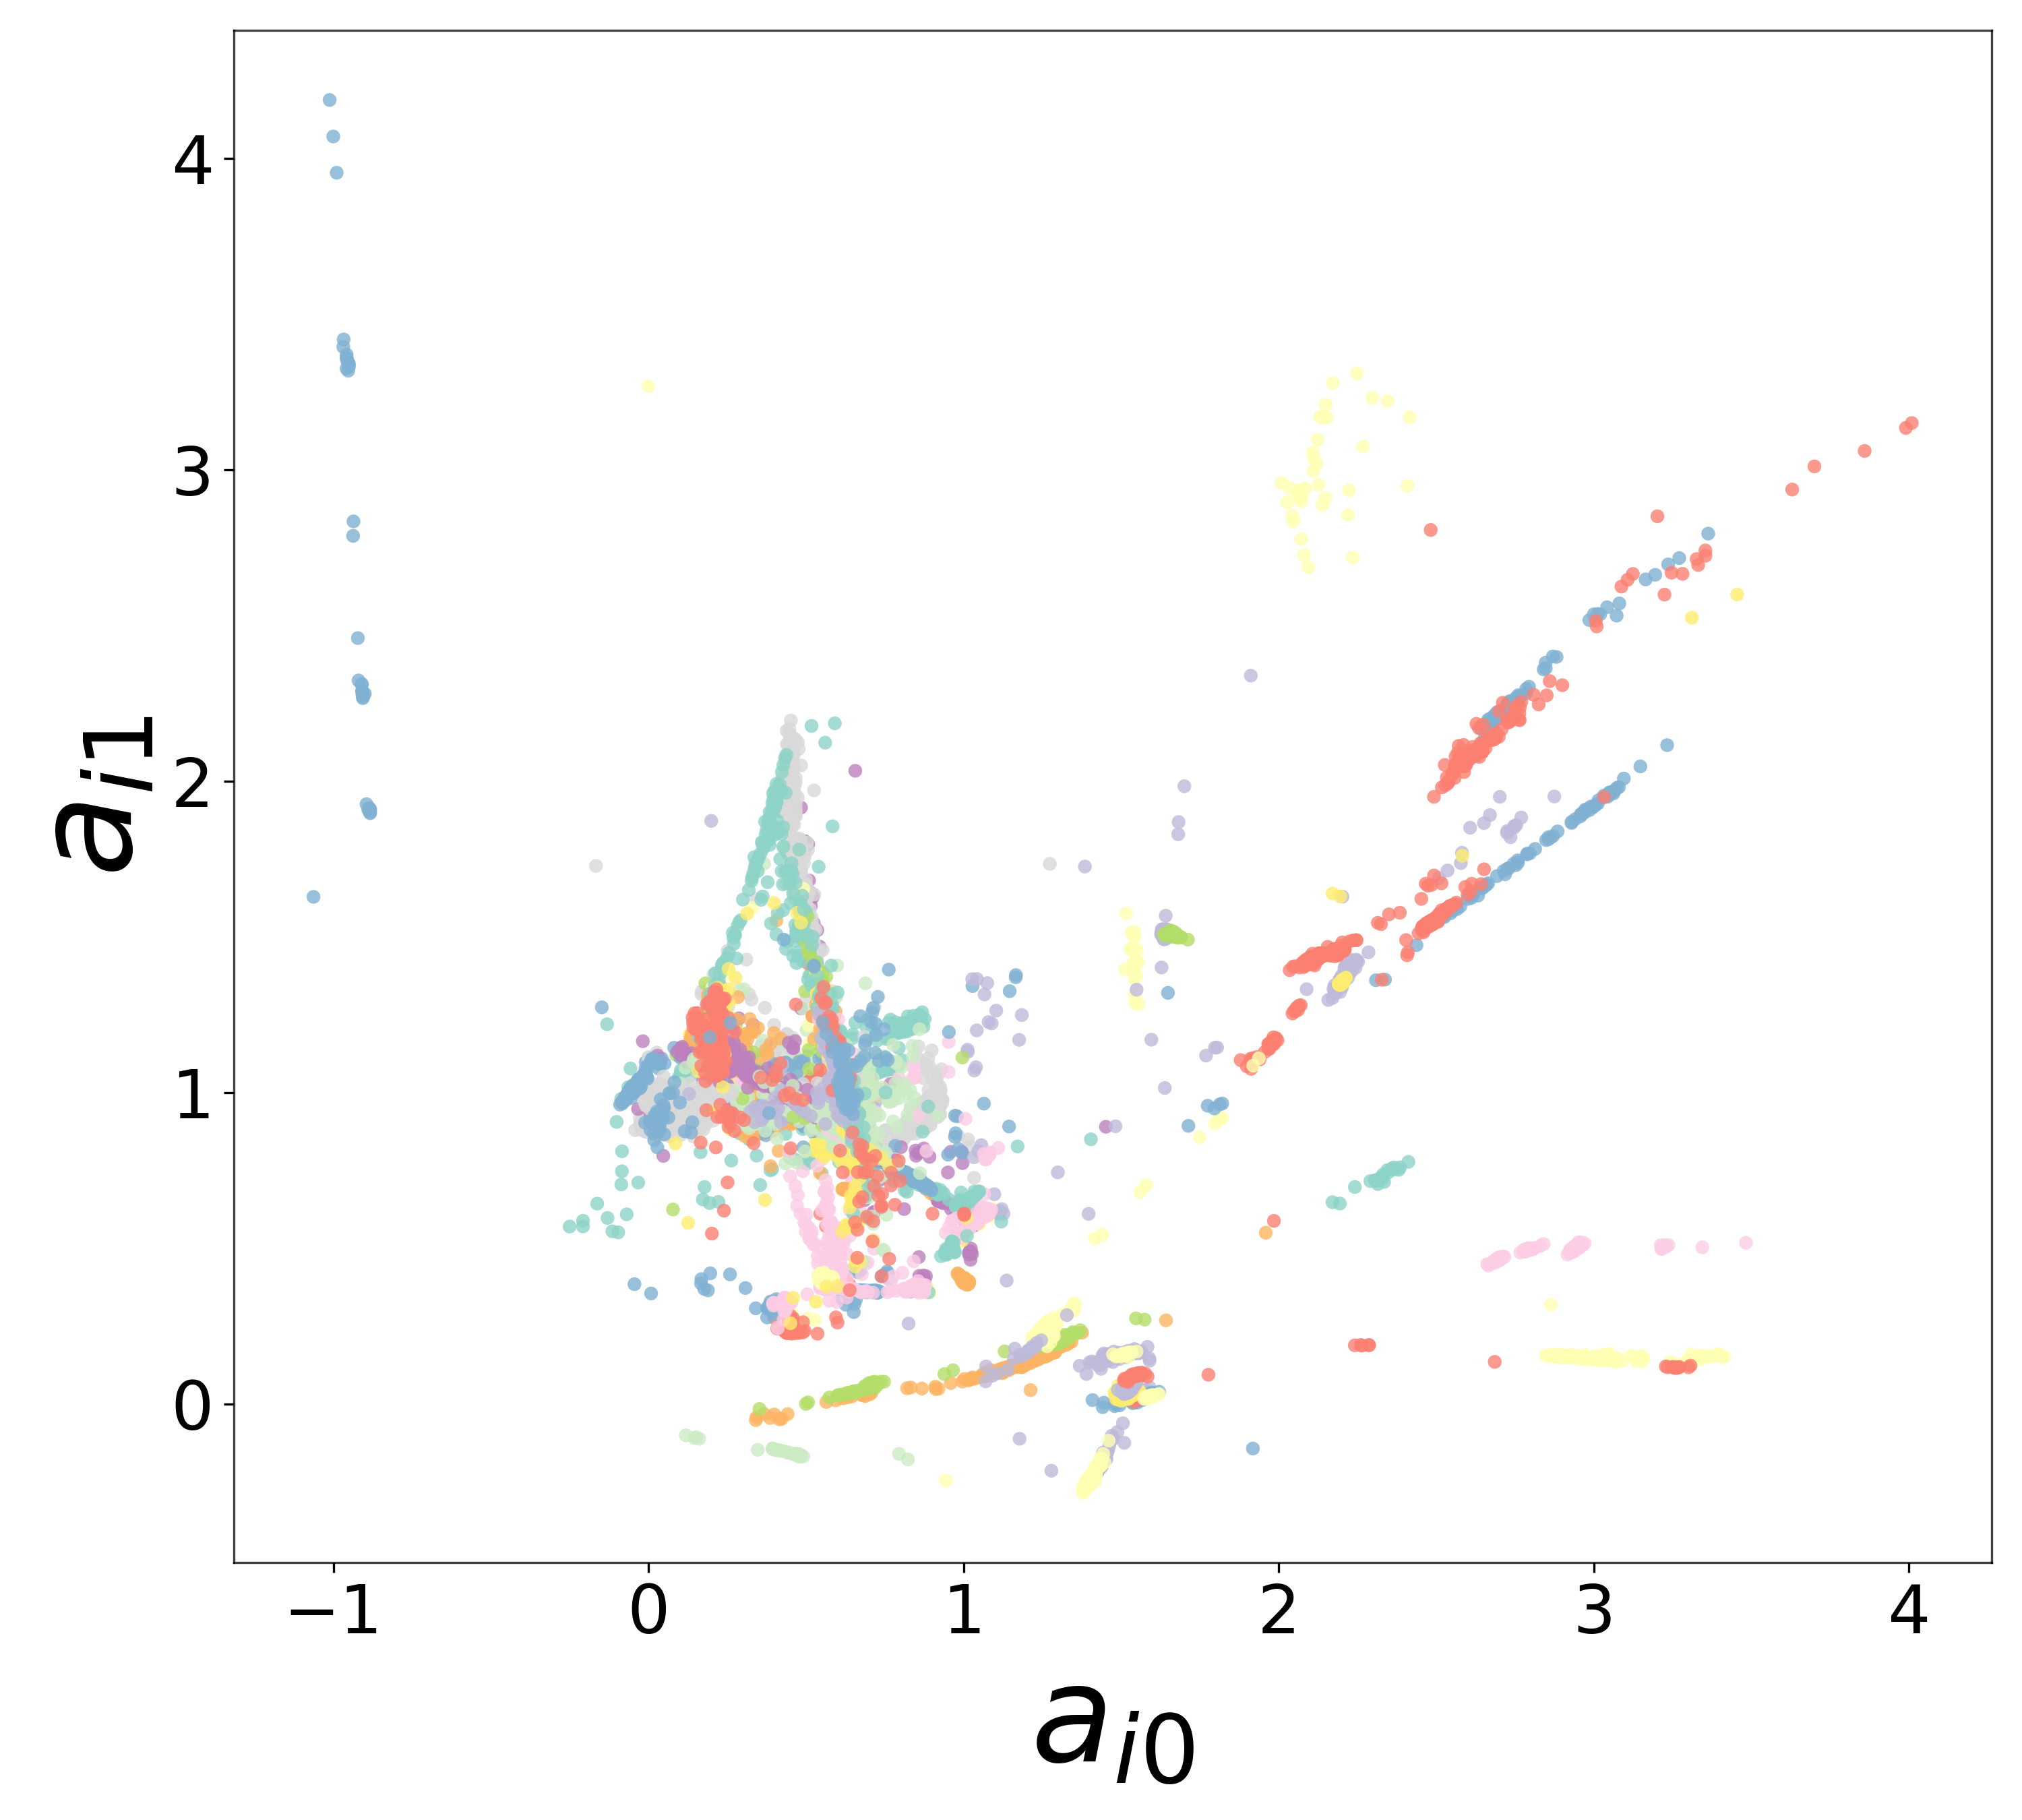
20% edges removed (86,822 removed / 347,290 remaining)
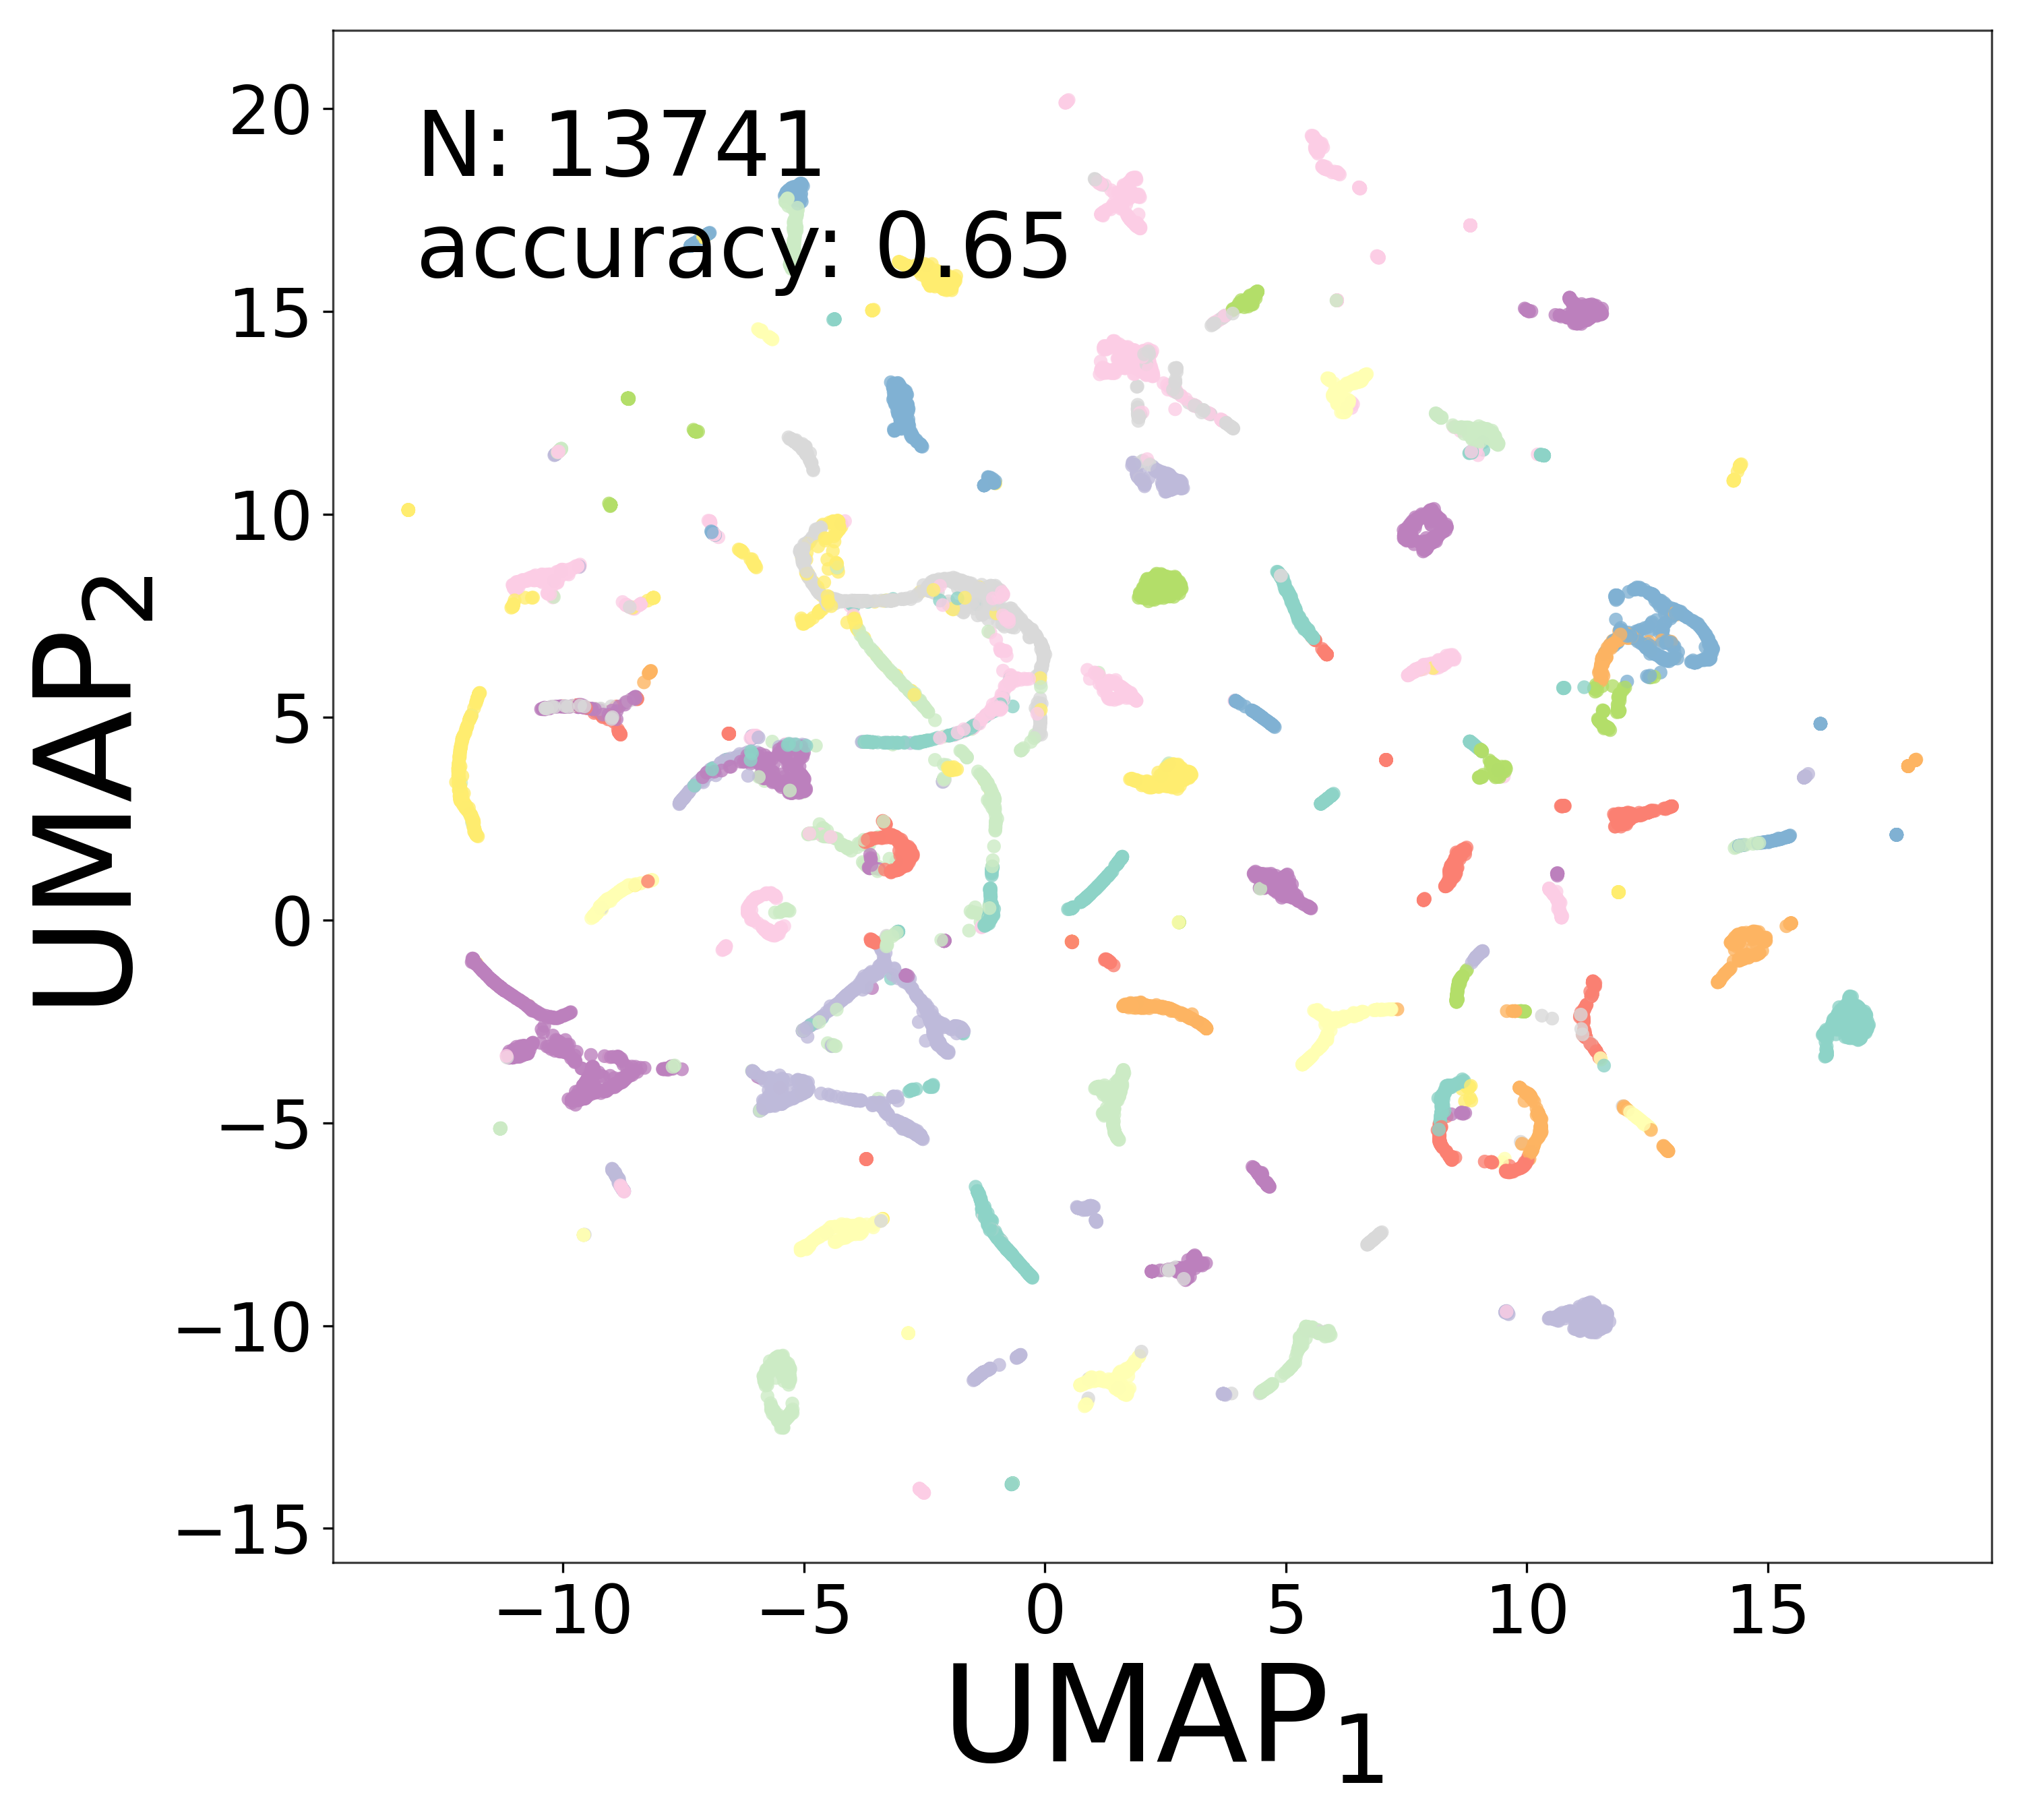
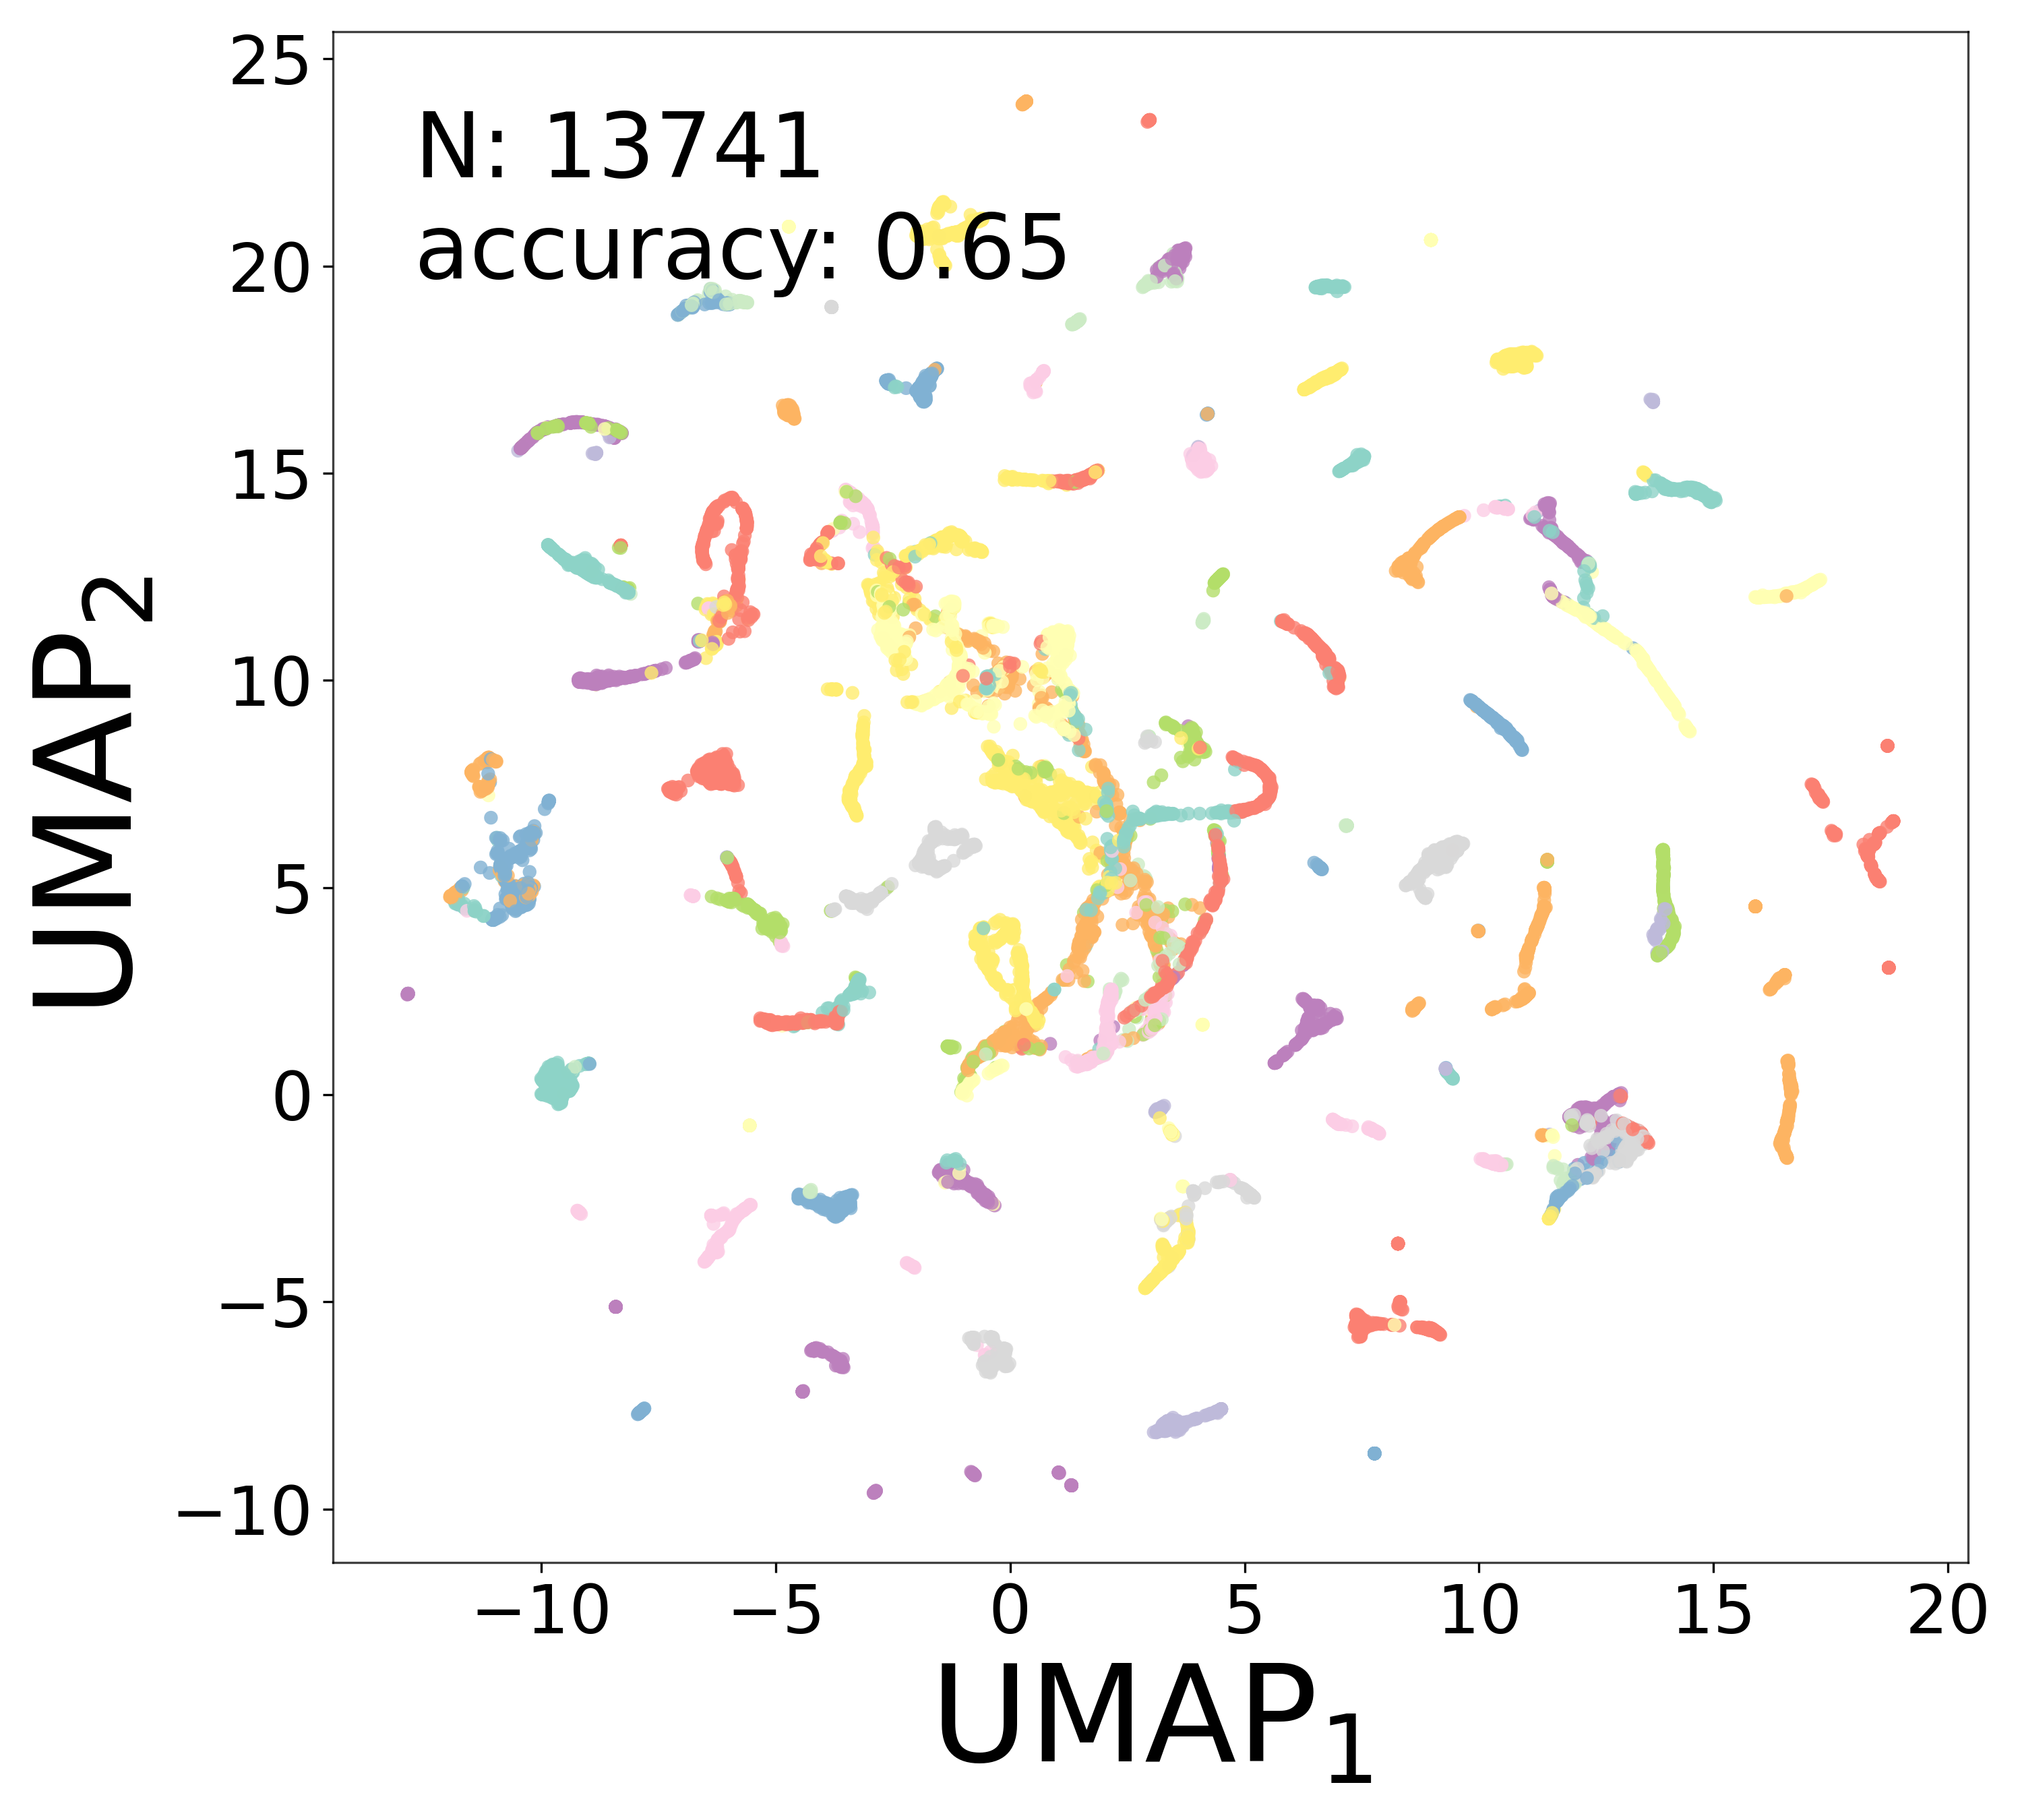
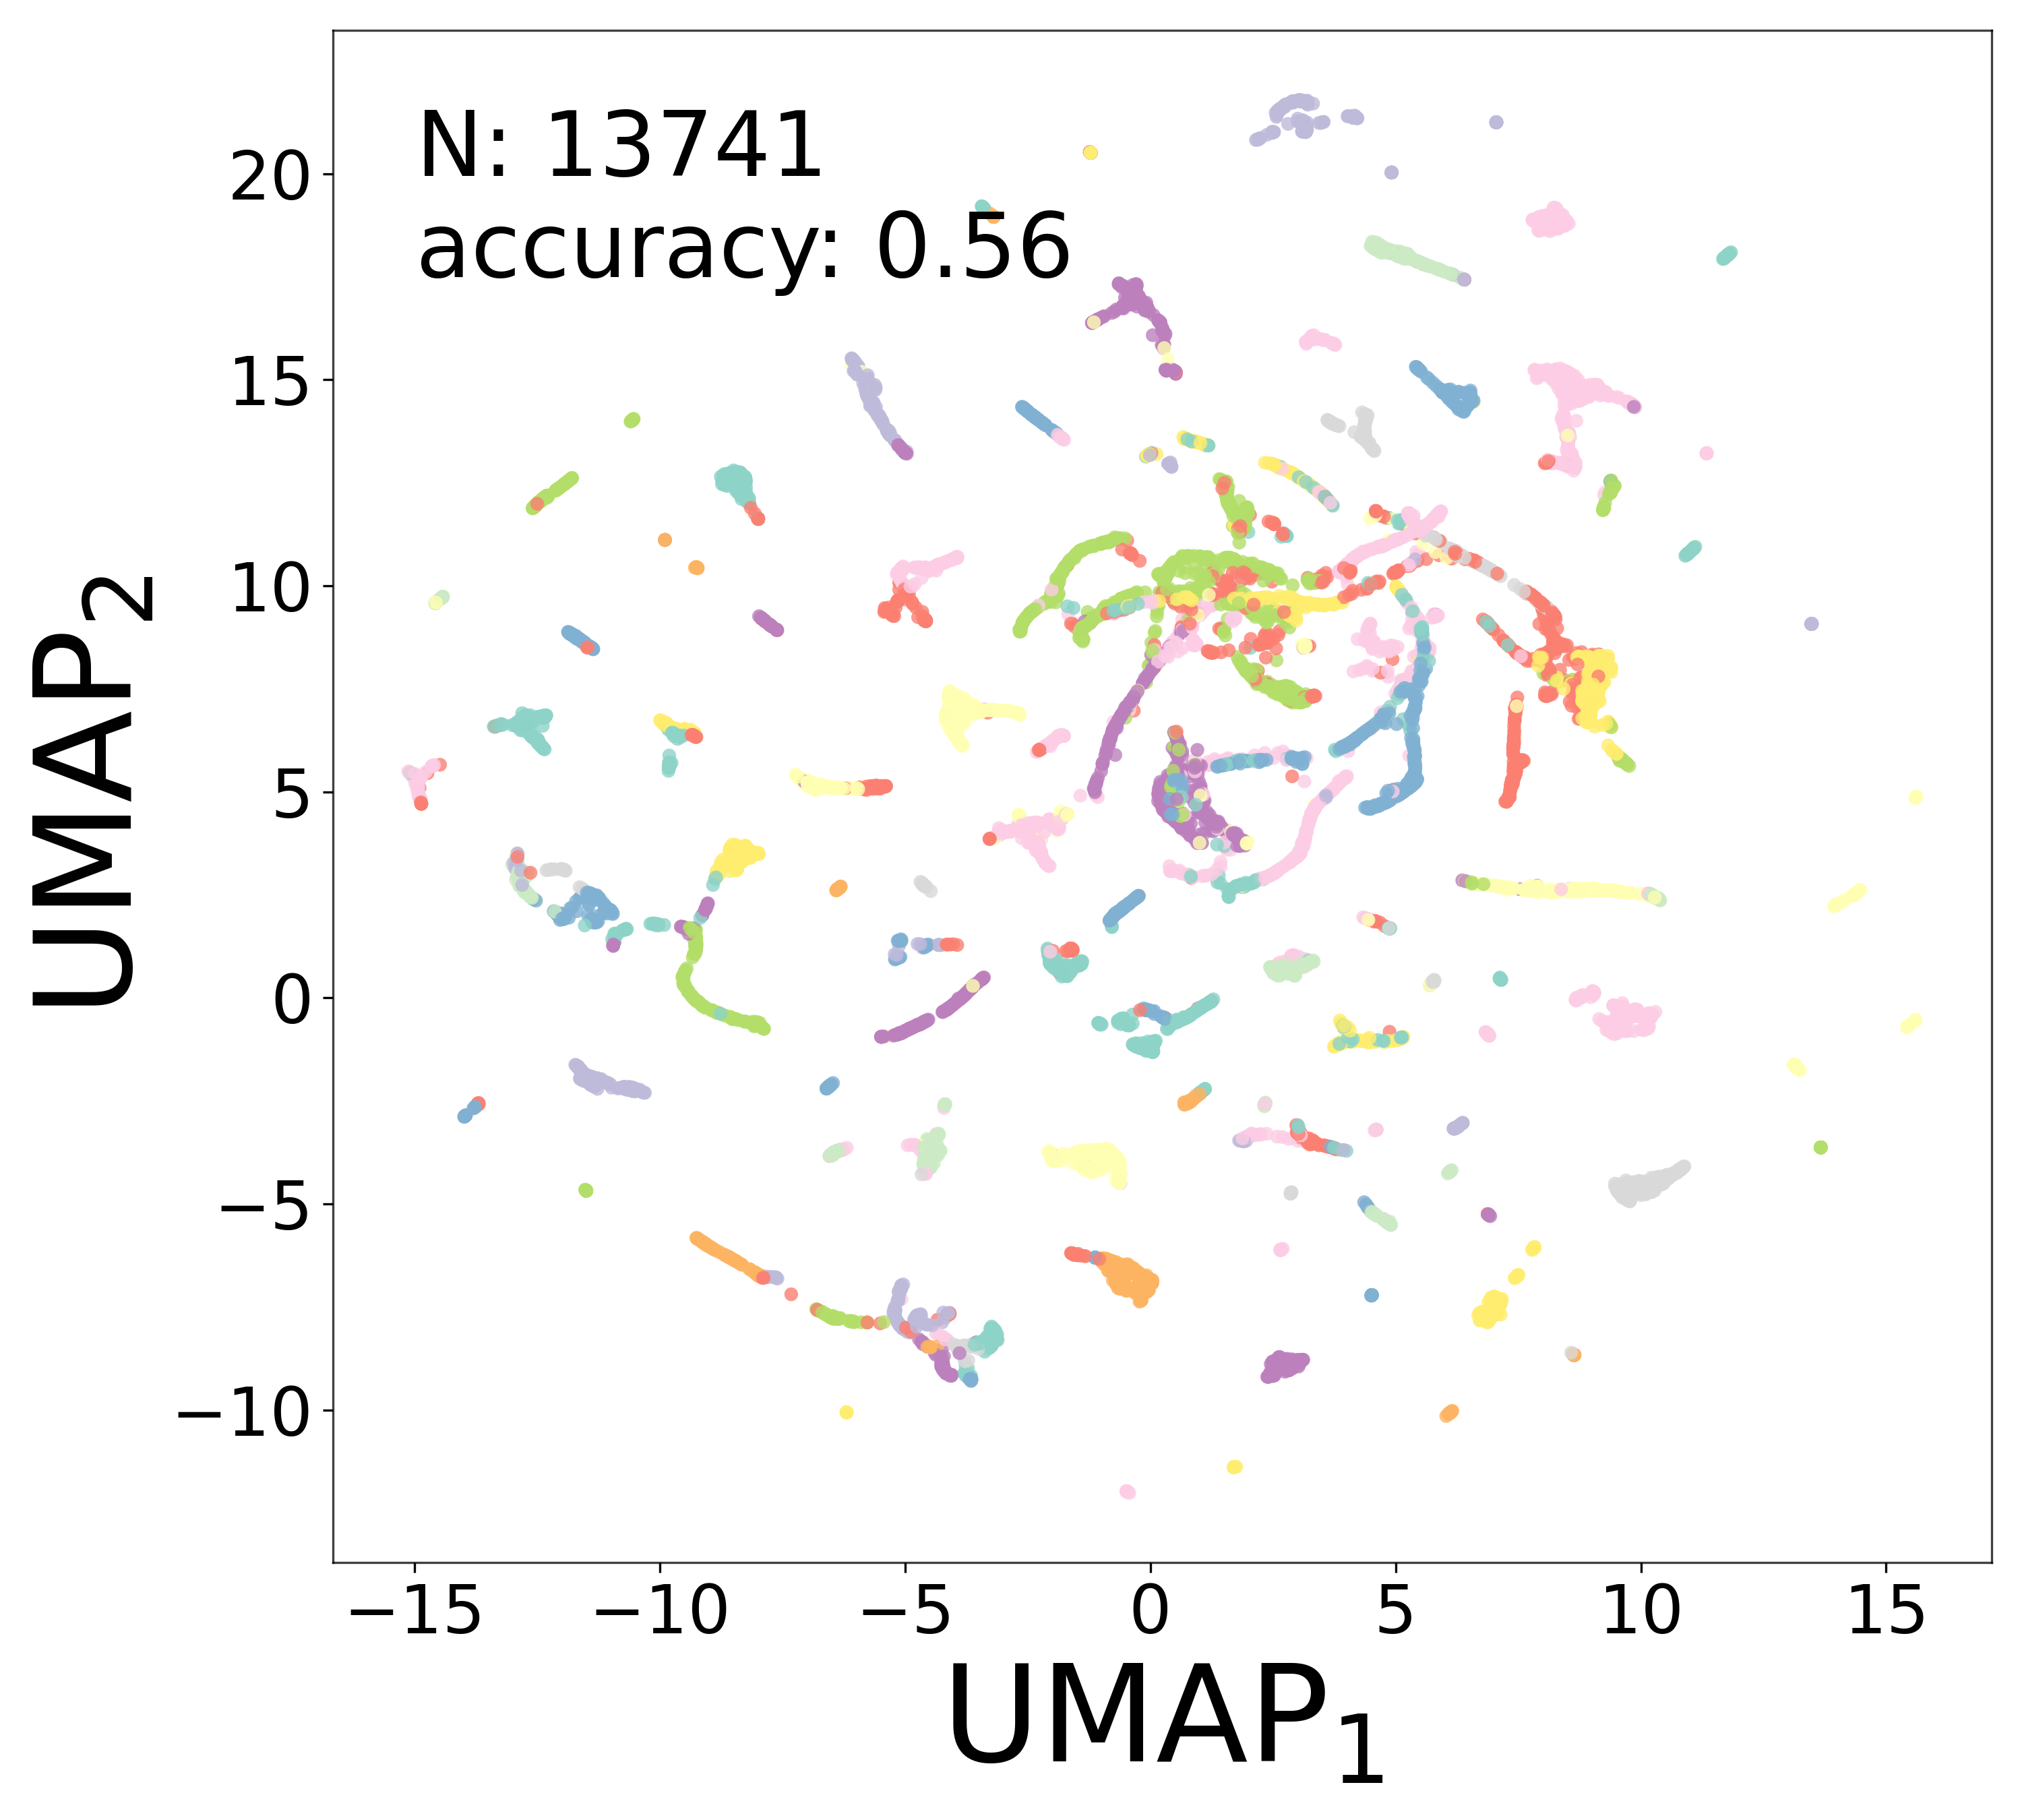
UMAP Projections
2% edges removed (8,682 removed / 425,430 remaining)
5% edges removed (21,706 removed / 412,406 remaining)
10% edges removed (43,411 removed / 390,701 remaining)
20% edges removed (86,822 removed / 347,290 remaining)
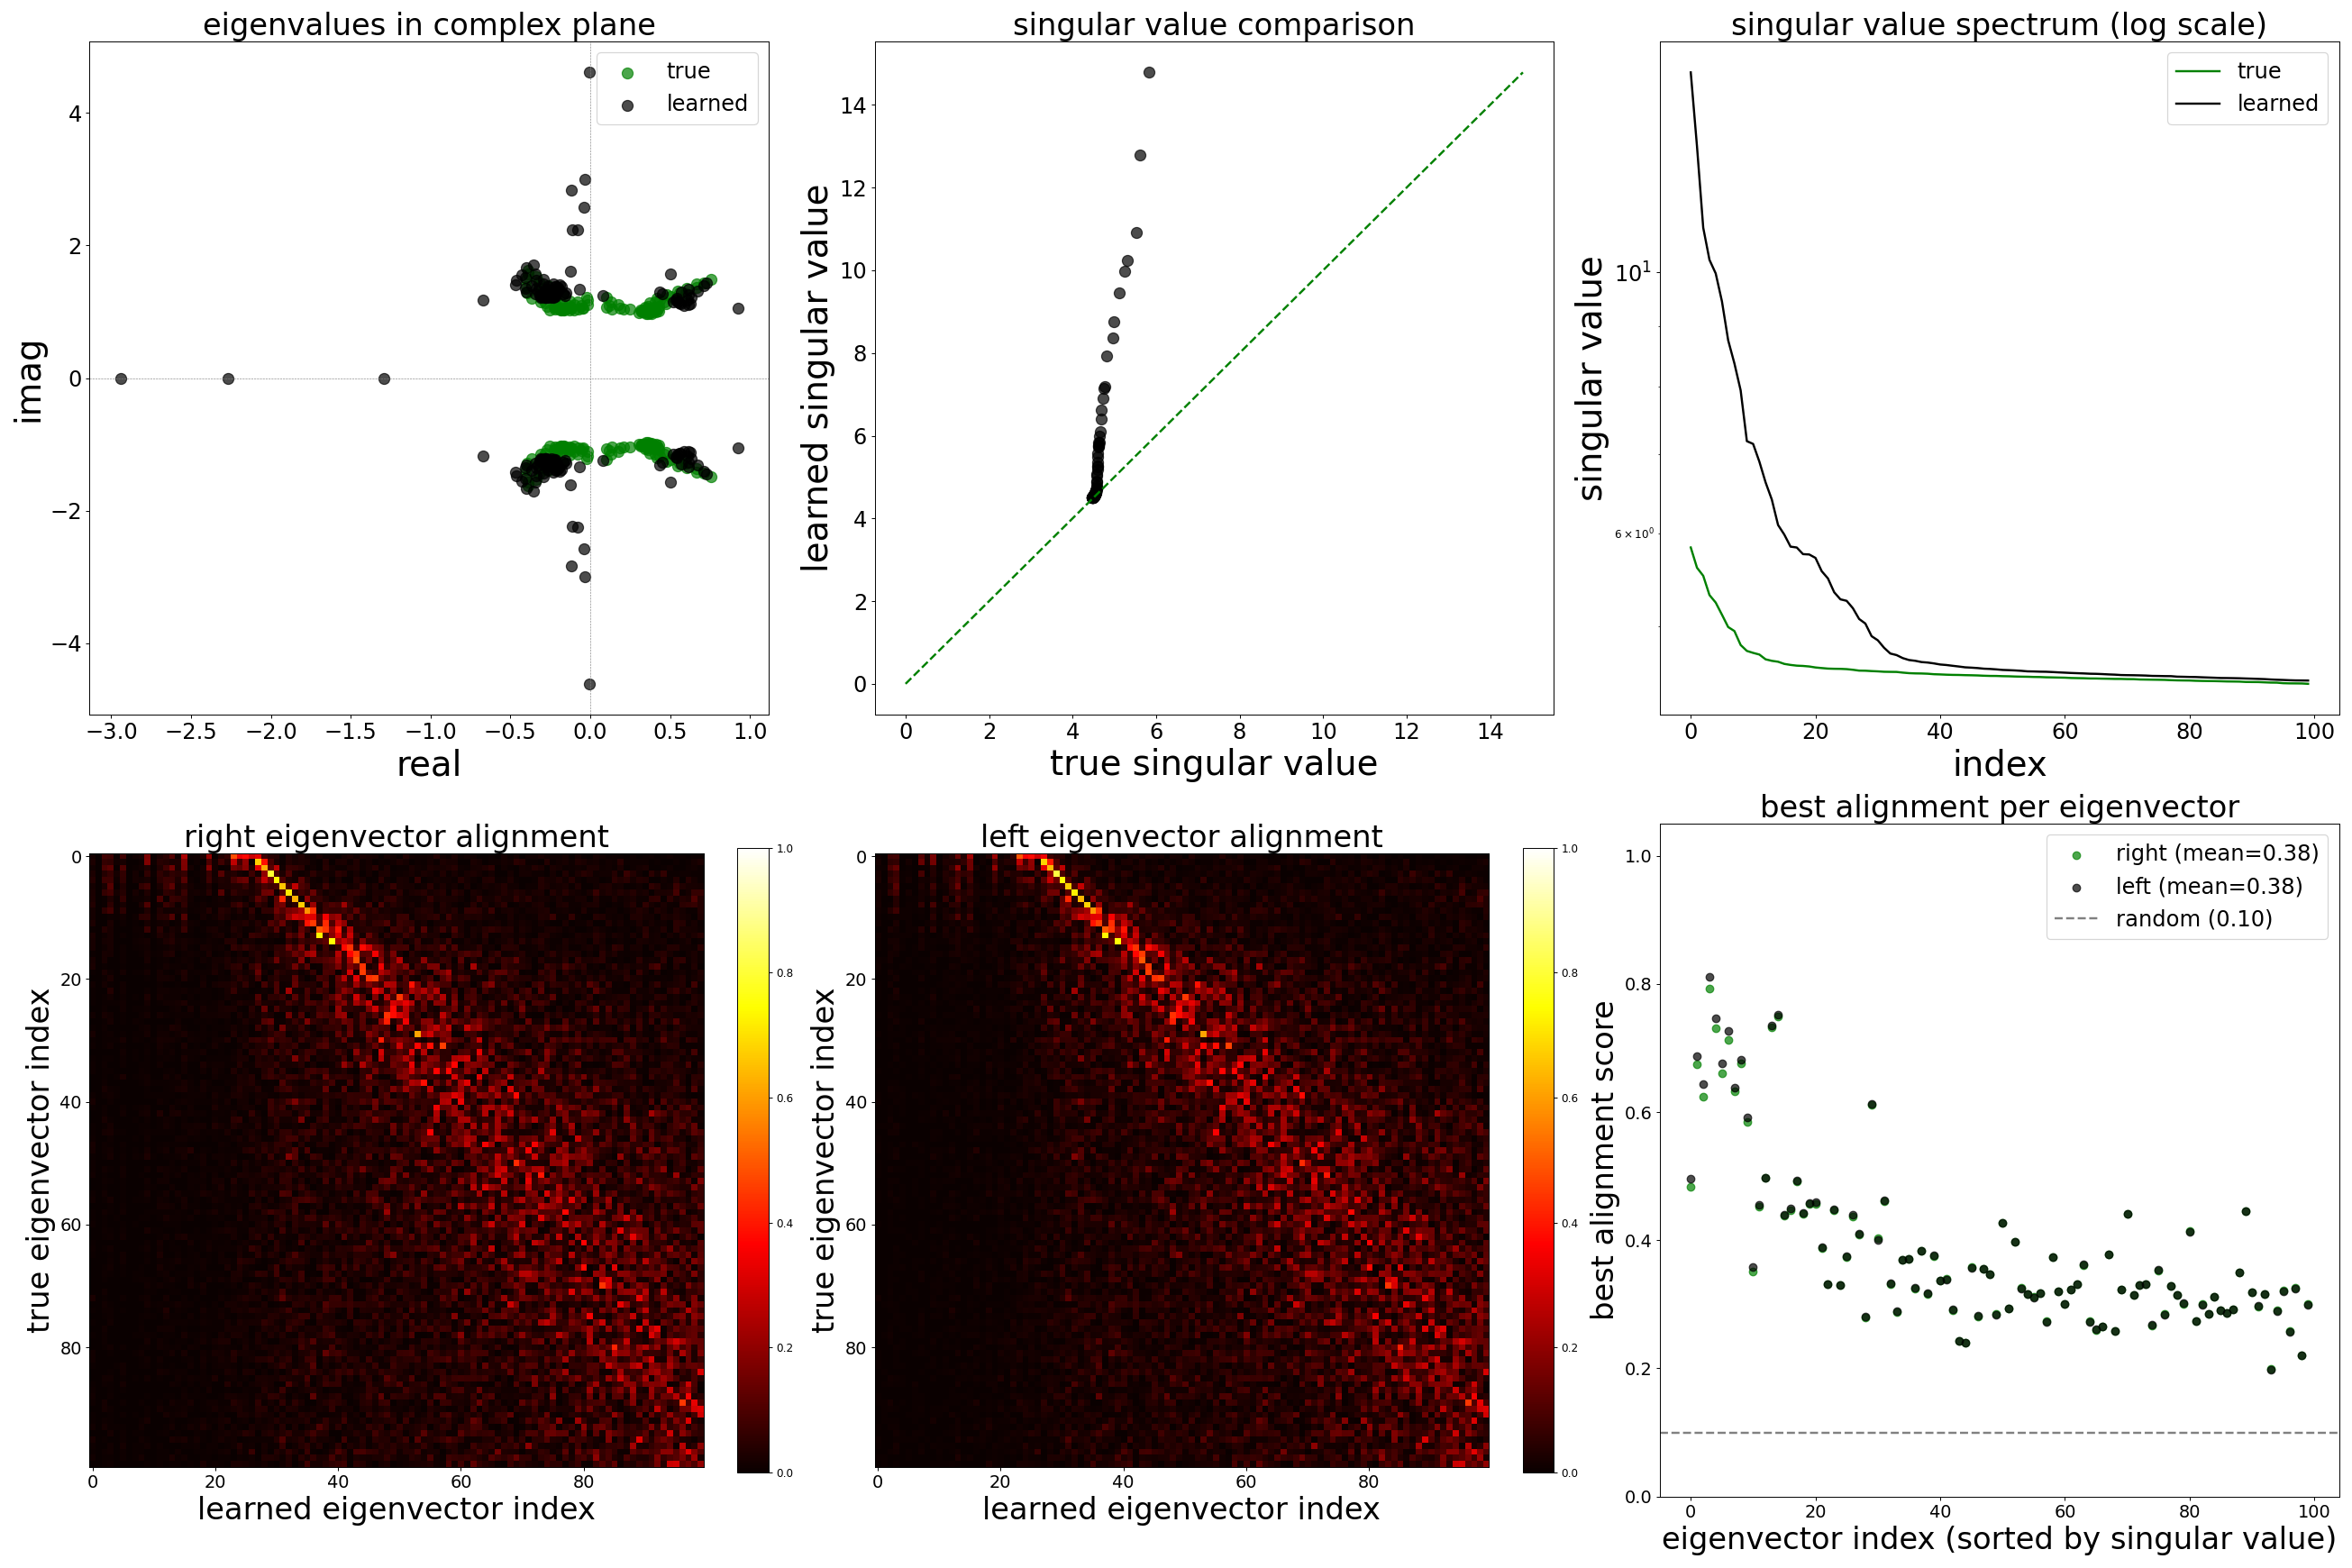
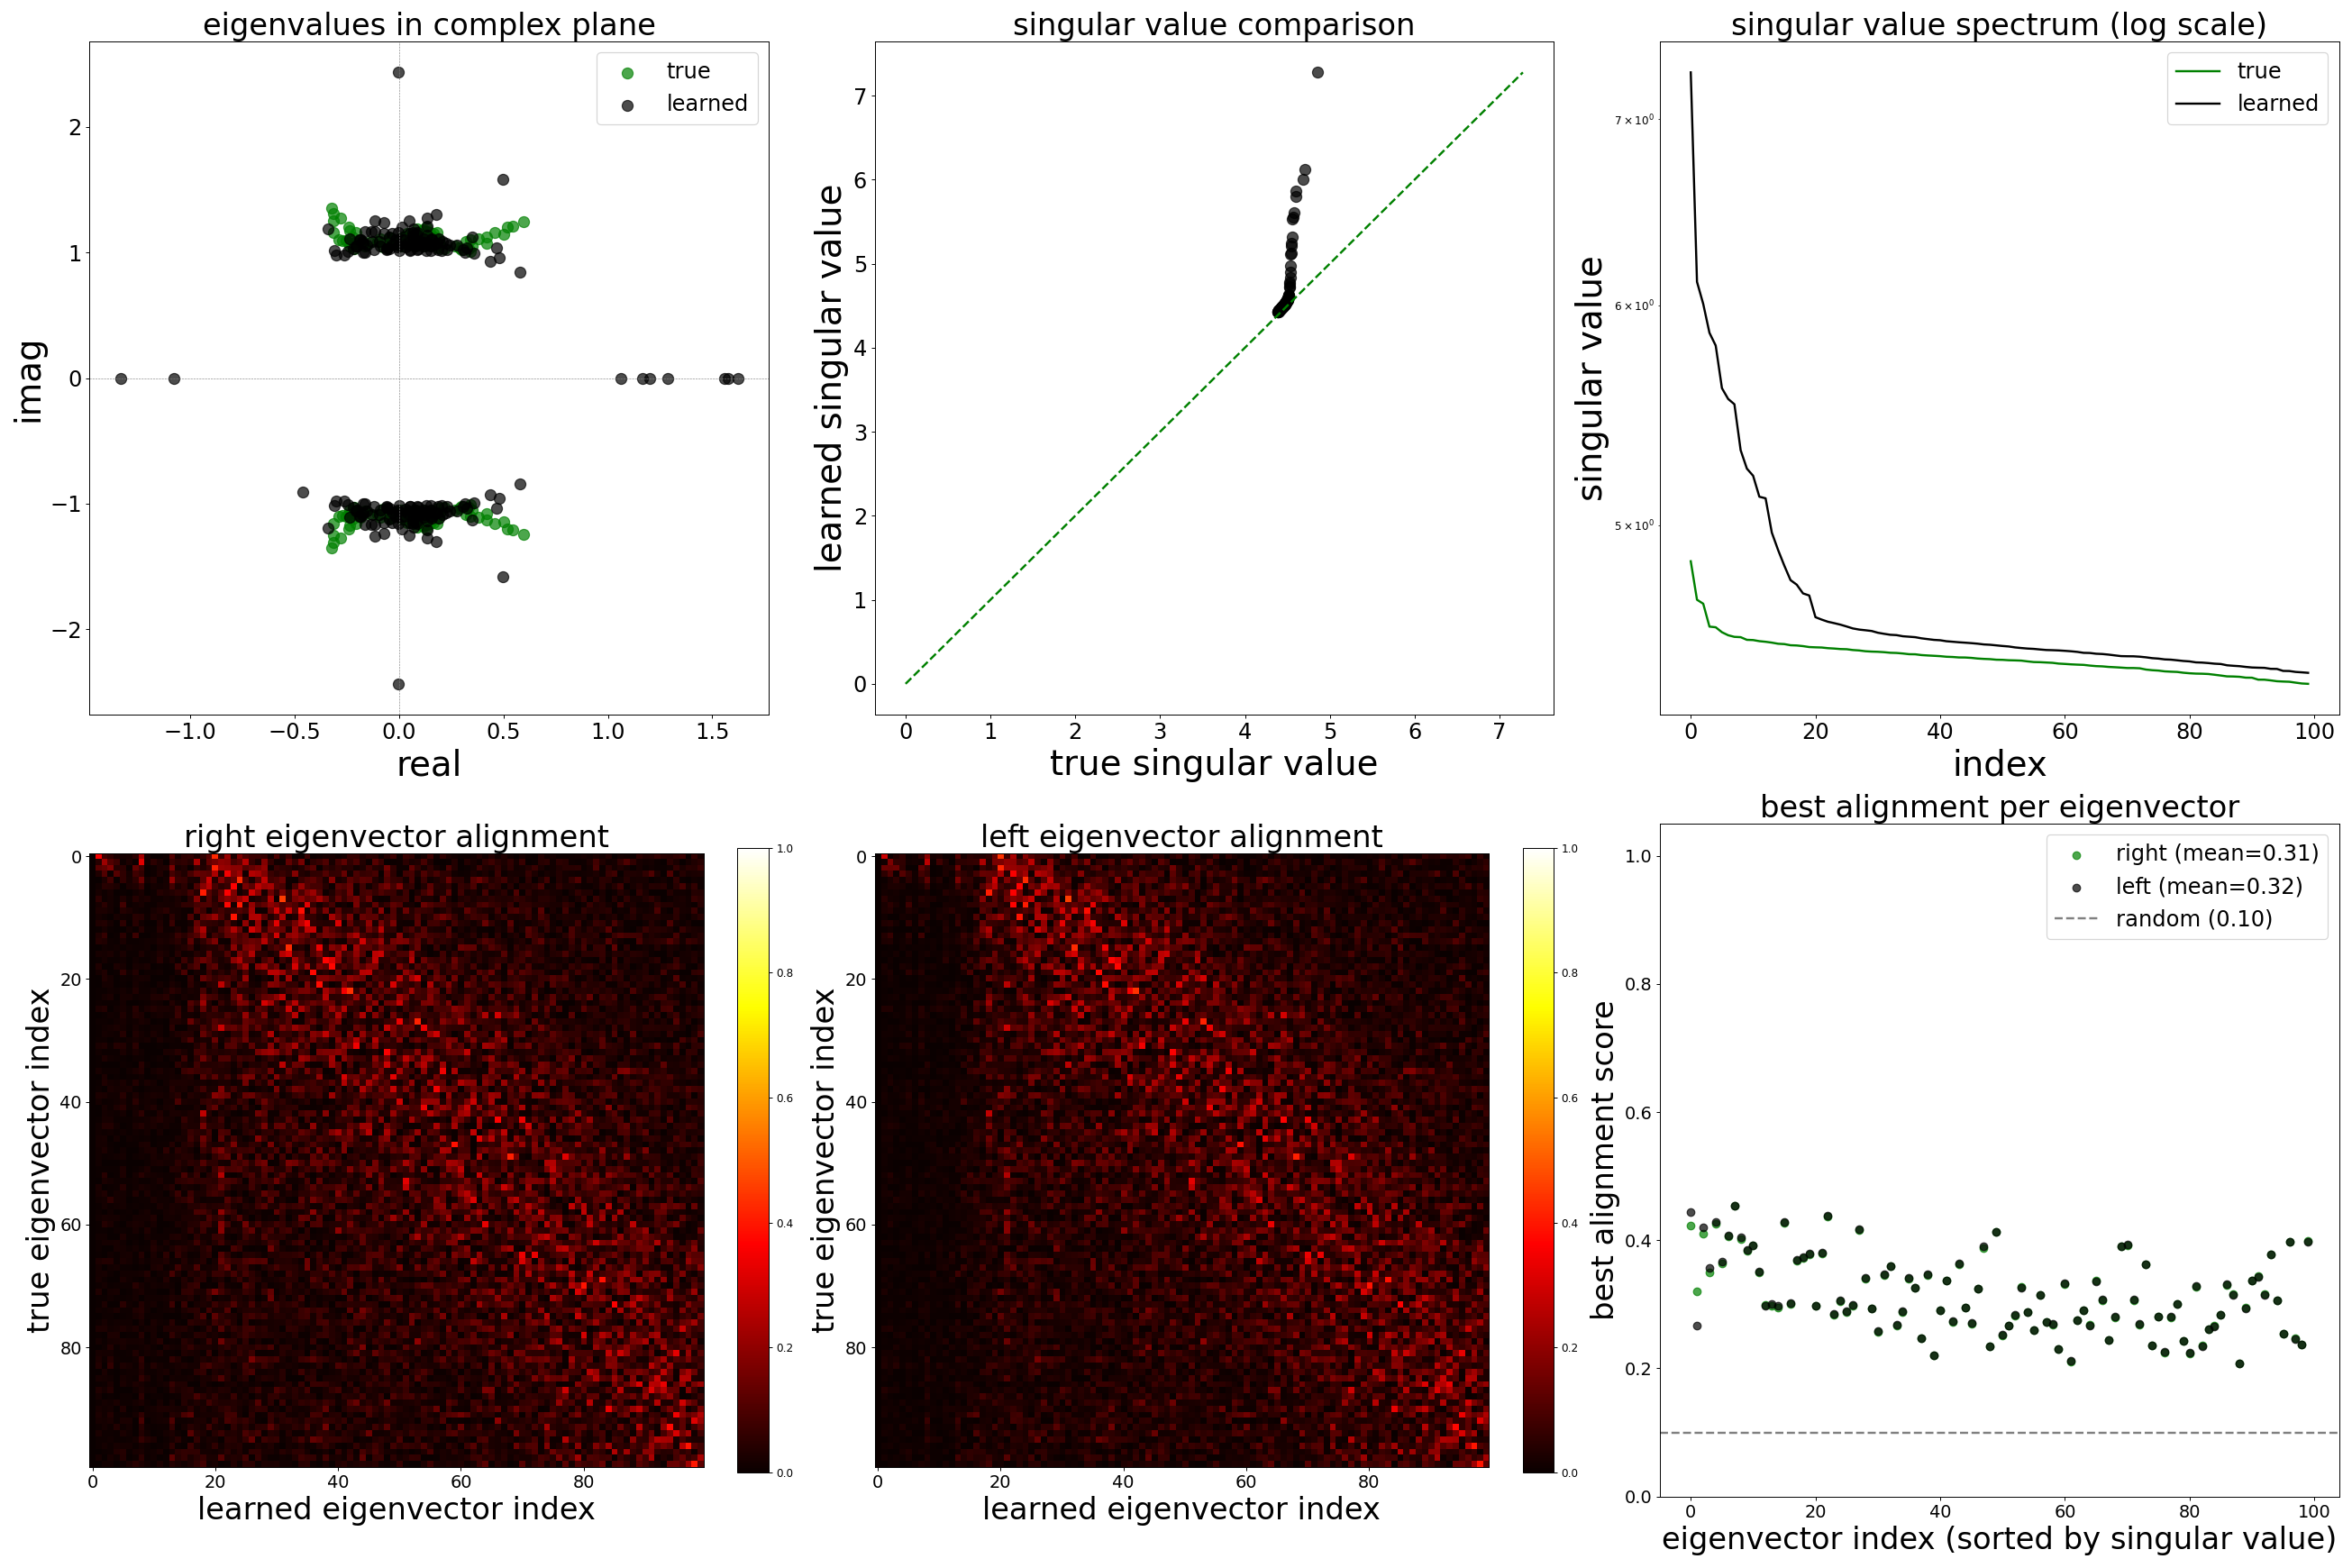
Spectral Analysis
2% edges removed (8,682 removed / 425,430 remaining)
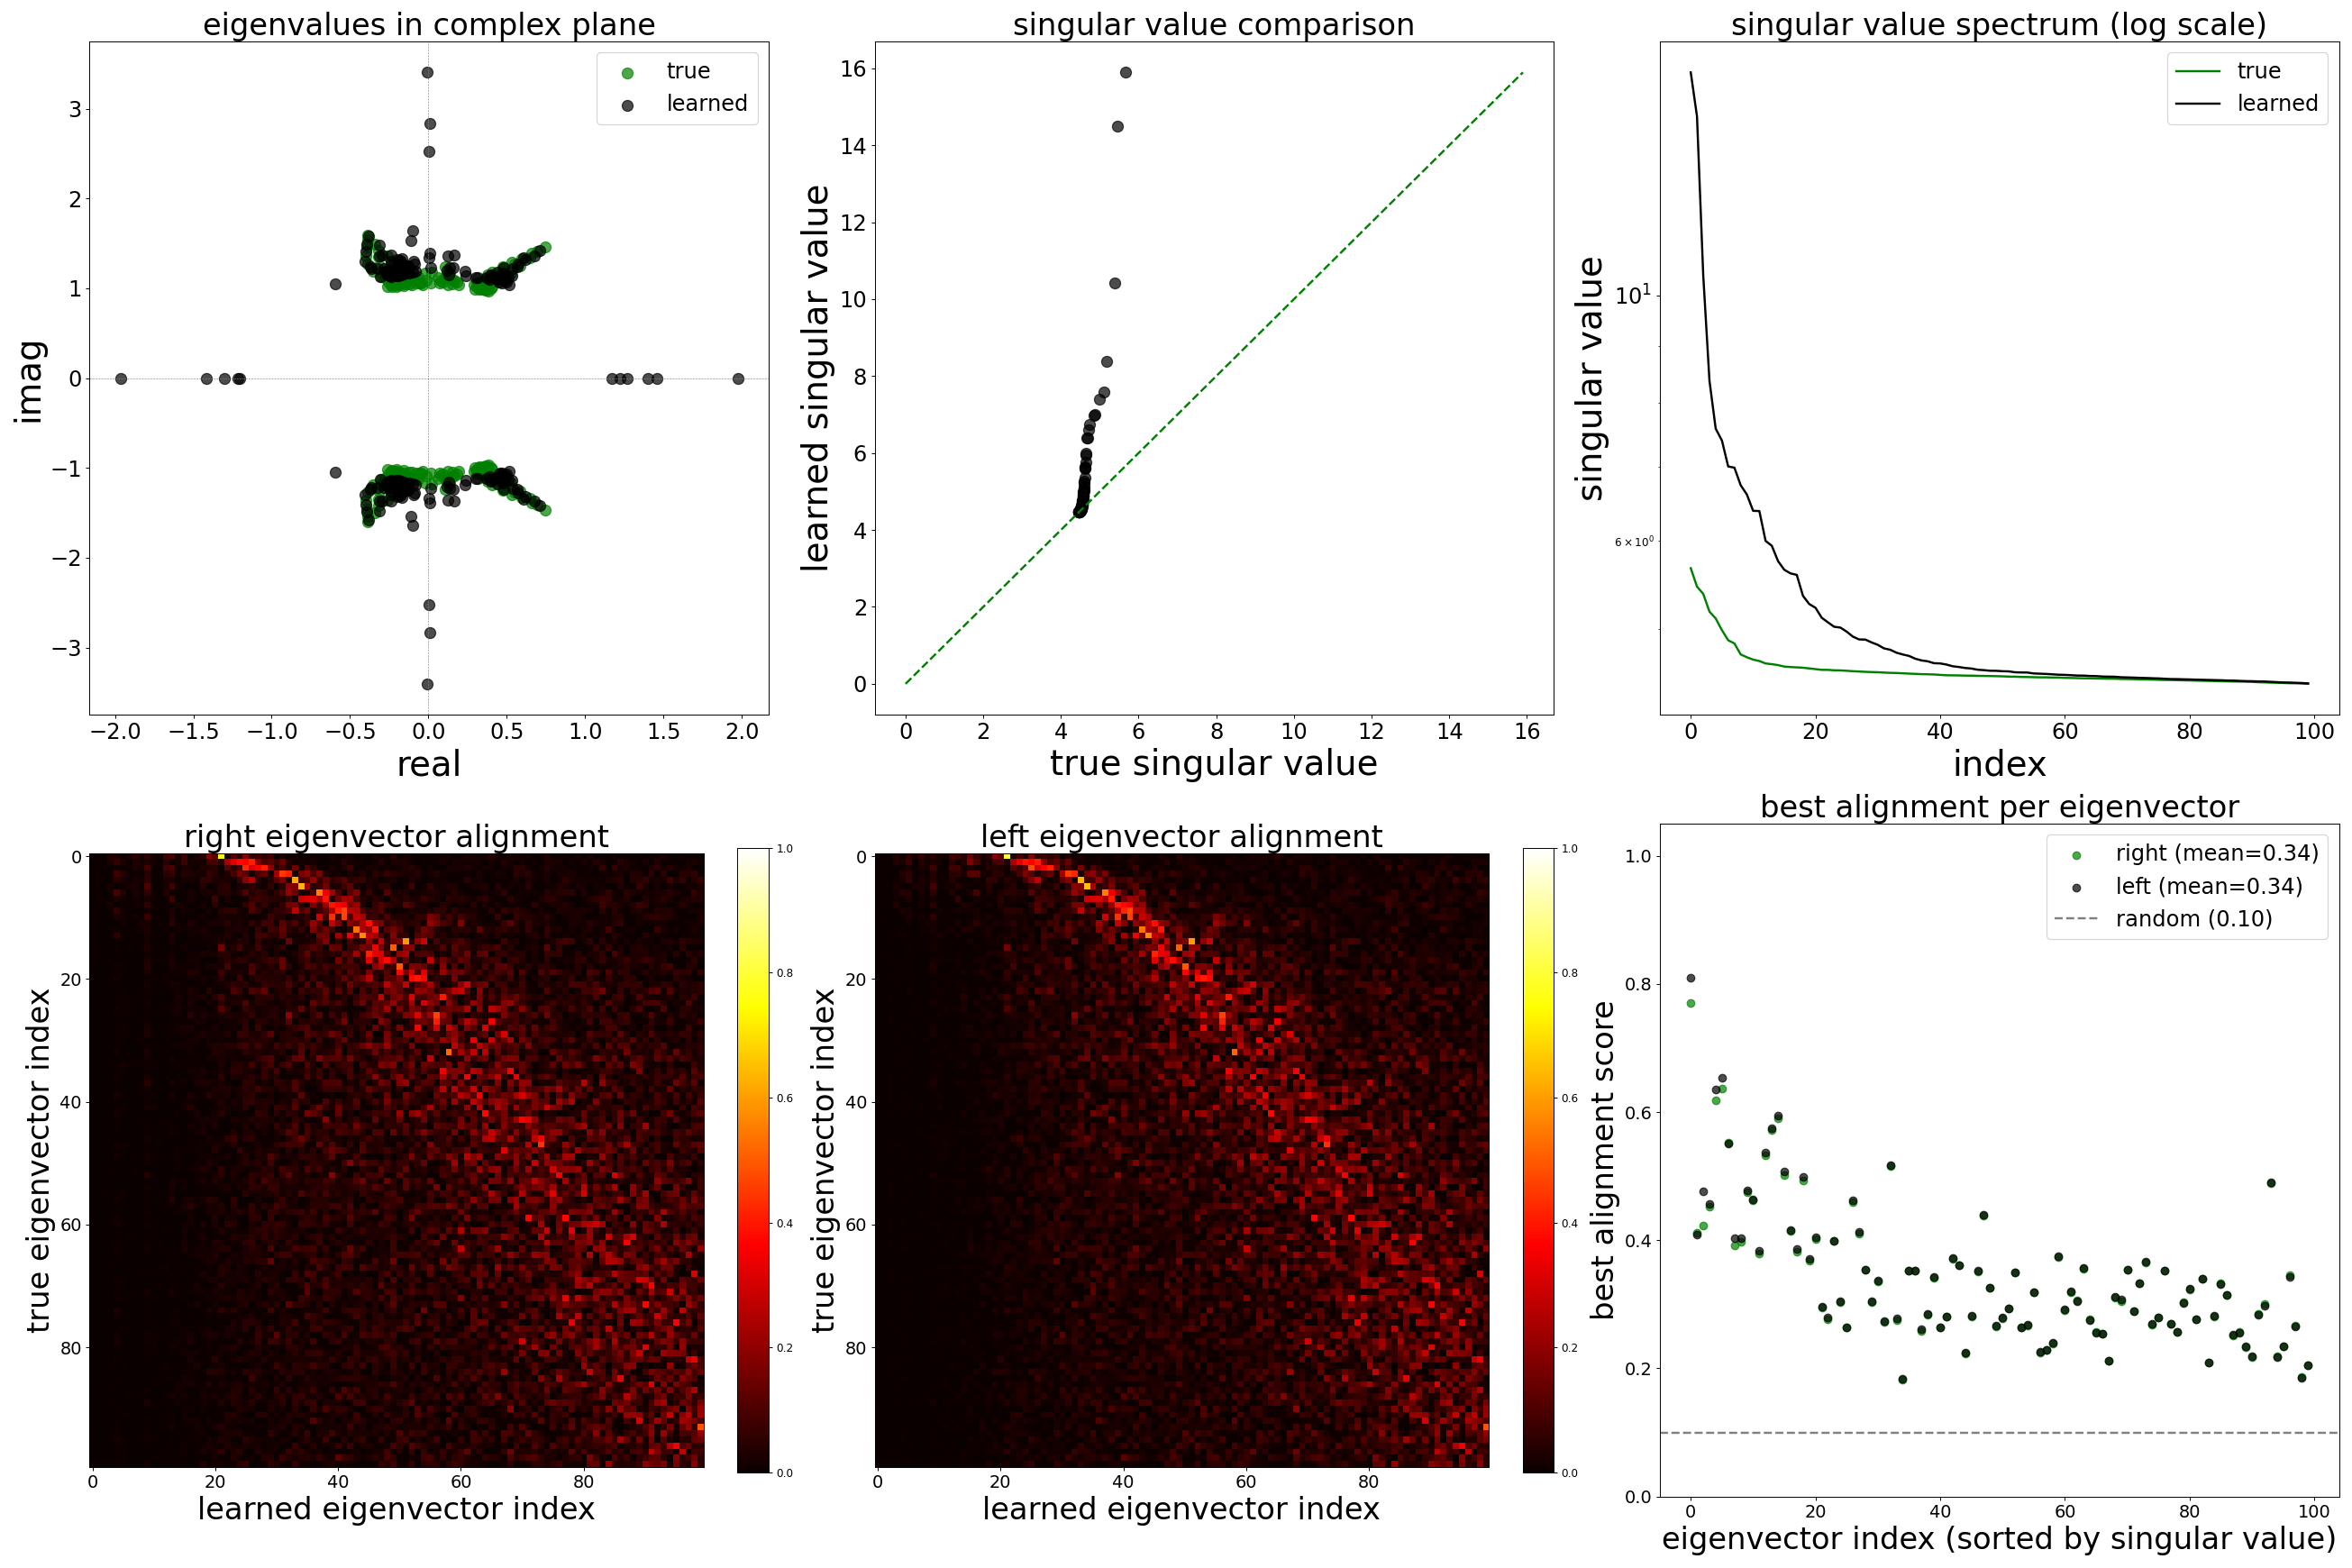
5% edges removed (21,706 removed / 412,406 remaining)
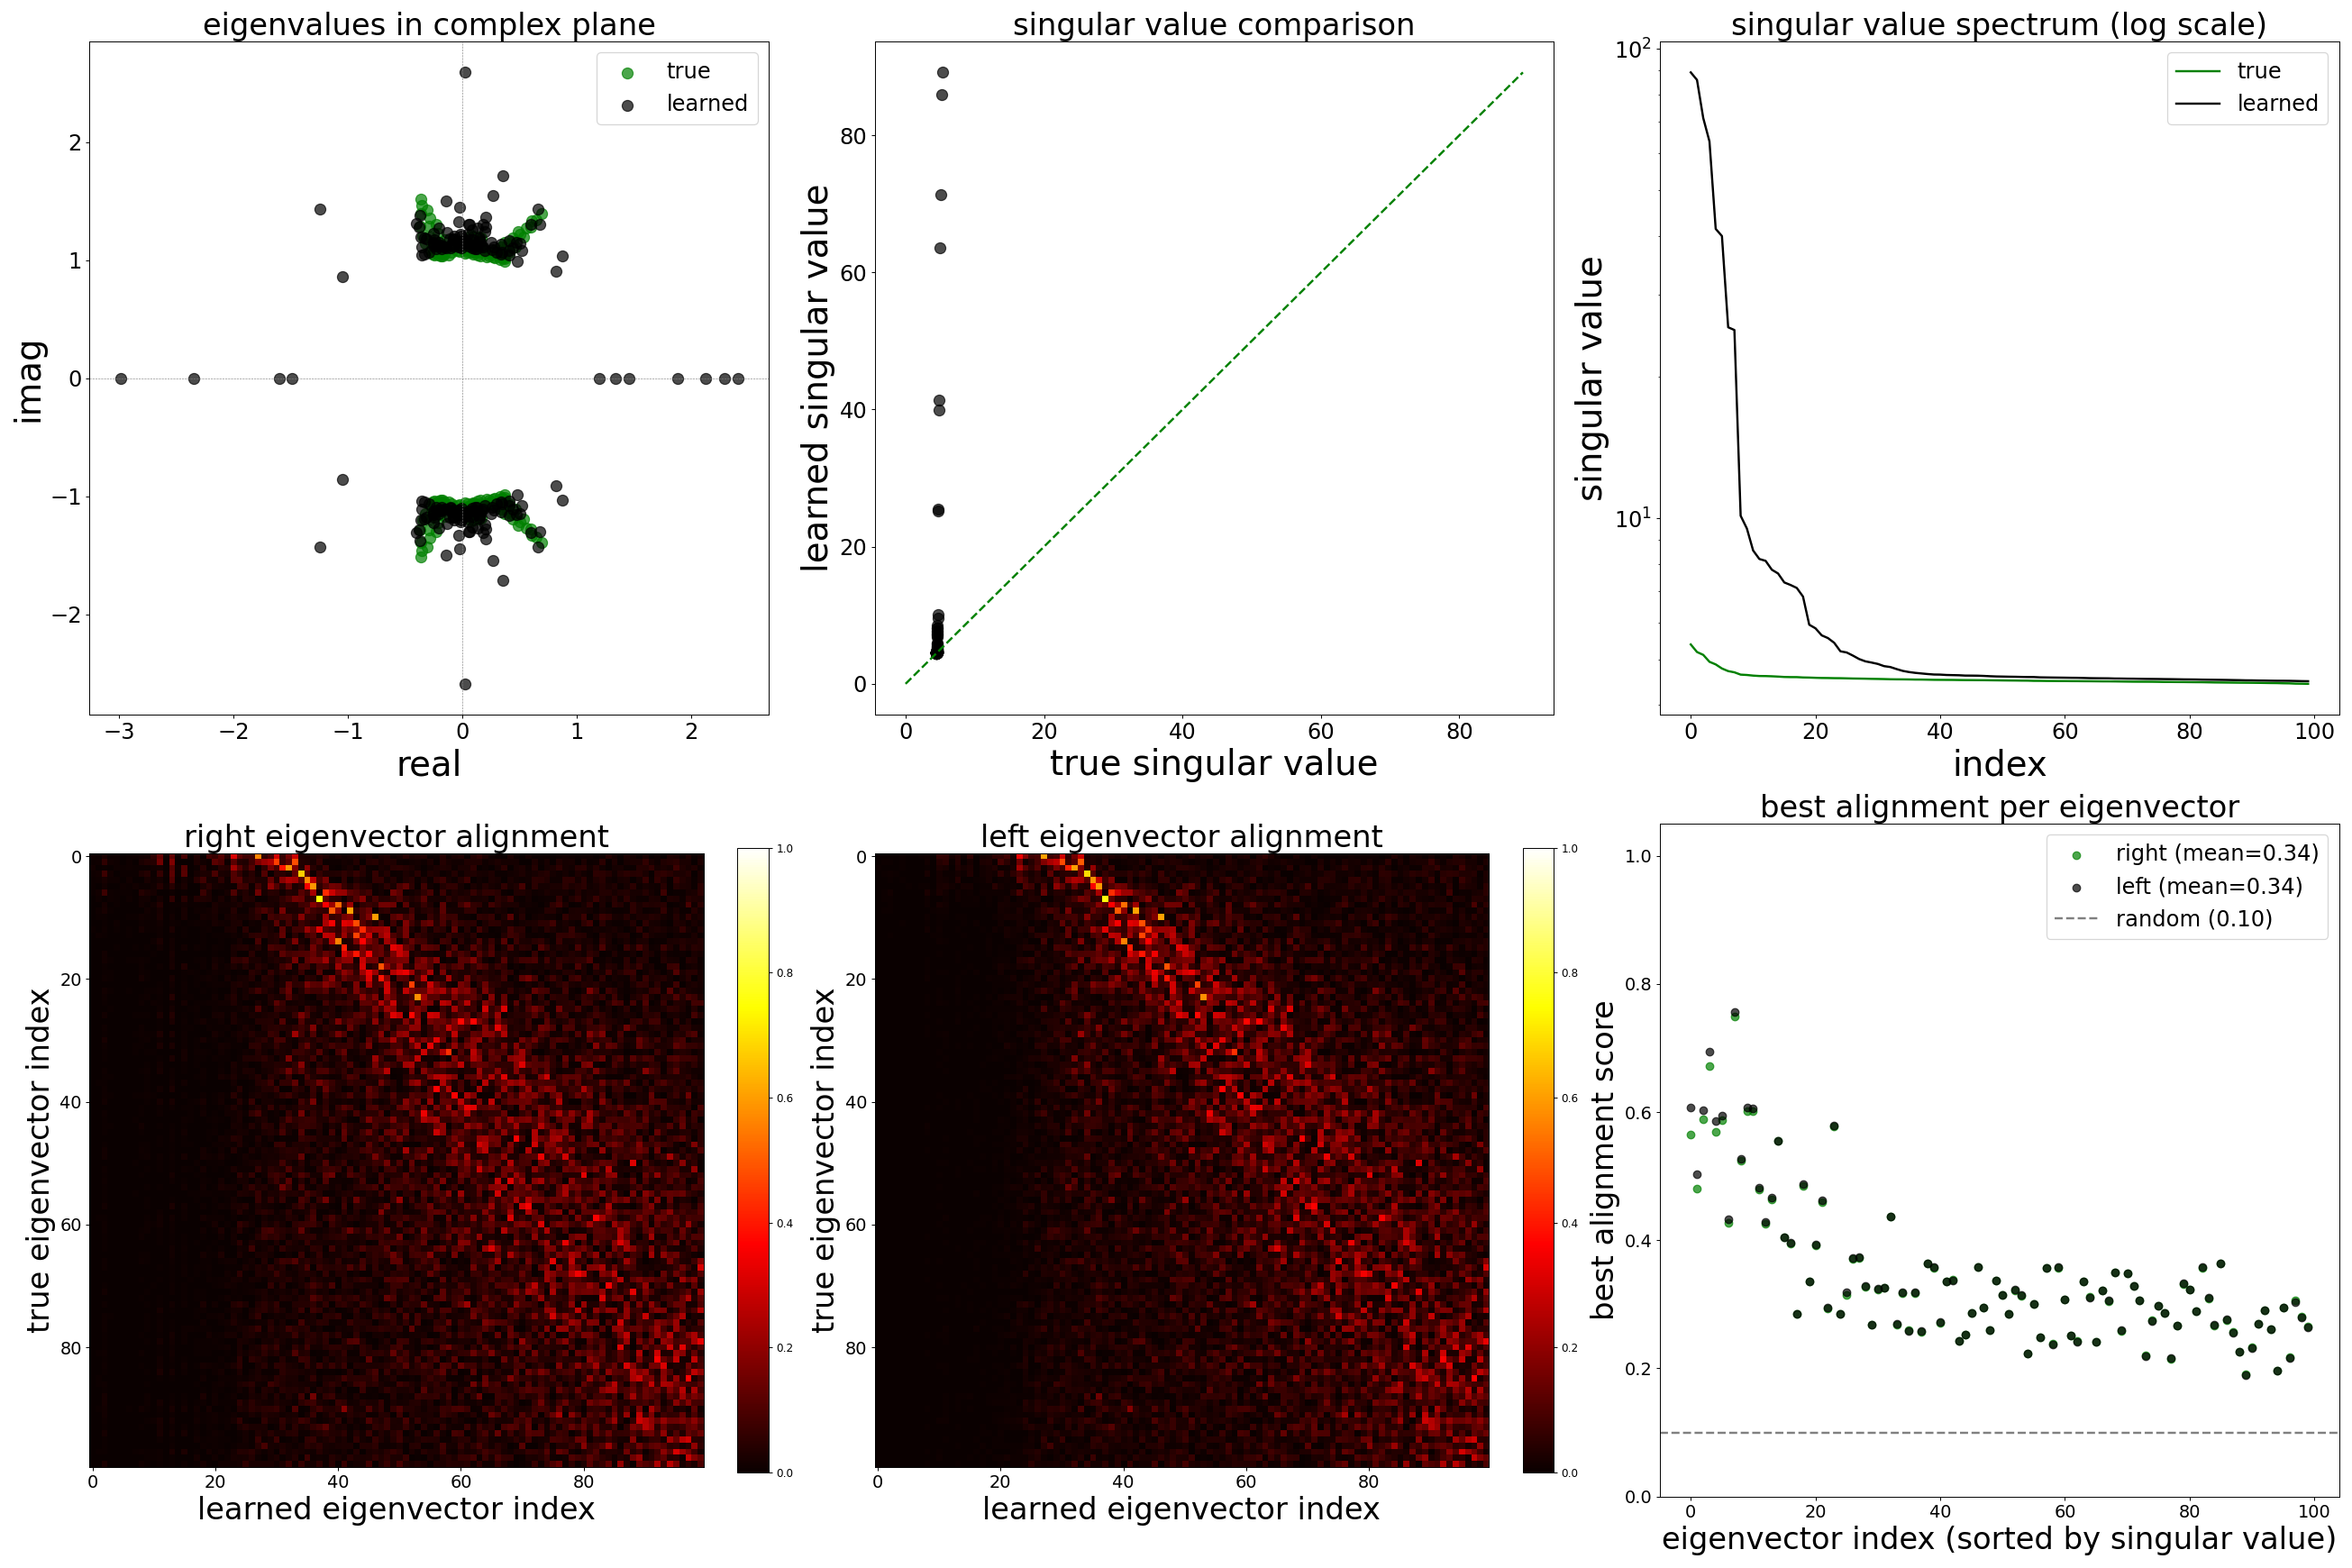
10% edges removed (43,411 removed / 390,701 remaining)
20% edges removed (86,822 removed / 347,290 remaining)
Rollout Metrics
| Metric | 2% | 5% | 10% | 20% |
|---|---|---|---|---|
| RMSE | 0.1028 +/- 0.0537 | 0.1057 +/- 0.0556 | 0.0986 +/- 0.0506 | 0.0932 +/- 0.0524 |
| Pearson r | 0.761 +/- 0.247 | 0.756 +/- 0.250 | 0.748 +/- 0.256 | 0.728 +/- 0.269 |
References
[1] J. K. Lappalainen et al., “Connectome-constrained networks predict neural activity across the fly visual system,” Nature, 2024. doi:10.1038/s41586-024-07939-3
[2] C. Allier, L. Heinrich, M. Schneider, S. Saalfeld, “Graph neural networks uncover structure and functions underlying the activity of simulated neural assemblies,” arXiv:2602.13325, 2026. doi:10.48550/arXiv.2602.13325