config_file = 'boids_16_256_bis'
figure_id = 'supp13'
config = ParticleGraphConfig.from_yaml(f'./config/{config_file}.yaml')
device = set_device("auto")Generalization test of GNN trained on boids
Particles
Generalization Test
This script generates figures shown in Supplementary Figures 13. This is a generalization test of the GNN trained with the boids simulation . As a generalization test, the number of particle was multiplied by a factor of 4 (from 1,792 to 7,168) and the initial positions were split into 16 stripes to separate particle types.
First, we load the configuration file and set the device.
The following model is used to simulate the boids system with PyTorch Geometric.
class BoidsModel(pyg.nn.MessagePassing):
    """Interaction Network as proposed in this paper:
    https://proceedings.neurips.cc/paper/2016/hash/3147da8ab4a0437c15ef51a5cc7f2dc4-Abstract.html"""

    """
    Compute the acceleration of Boids as a function of their relative positions and relative positions.
    The interaction function is defined by three parameters p = (p1, p2, p3)

    Inputs
    ----------
    data : a torch_geometric.data object

    Returns
    -------
    pred : float
        the acceleration of the Boids (dimension 2)
    """

    def __init__(self, aggr_type=[], p=[], bc_dpos=[], dimension=2):
        super(BoidsModel, self).__init__(aggr=aggr_type)  # "mean" aggregation.

        self.p = p
        self.bc_dpos = bc_dpos
        self.dimension = dimension

        self.a1 = 0.5E-5
        self.a2 = 5E-4
        self.a3 = 1E-8
        self.a4 = 0.5E-5
        self.a5 = 1E-8

    def forward(self, data=[], has_field=False):
        x, edge_index = data.x, data.edge_index

        if has_field:
            field = x[:,6:7]
        else:
            field = torch.ones_like(x[:,0:1])

        edge_index, _ = pyg_utils.remove_self_loops(edge_index)
        particle_type = to_numpy(x[:, 1 + 2*self.dimension])
        parameters = self.p[particle_type, :]
        d_pos = x[:, self.dimension+1:1 + 2*self.dimension].clone().detach()
        dd_pos = self.propagate(edge_index, pos=x[:, 1:self.dimension+1], parameters=parameters, d_pos=d_pos, field=field)

        return dd_pos

    def message(self, pos_i, pos_j, parameters_i, d_pos_i, d_pos_j, field_j):
        distance_squared = torch.sum(self.bc_dpos(pos_j - pos_i) ** 2, axis=1)  # distance squared

        cohesion = parameters_i[:,0,None] * self.a1 * self.bc_dpos(pos_j - pos_i)
        alignment = parameters_i[:,1,None] * self.a2 * self.bc_dpos(d_pos_j - d_pos_i)
        separation = - parameters_i[:,2,None] * self.a3 * self.bc_dpos(pos_j - pos_i) / distance_squared[:, None]

        return (separation + alignment + cohesion) * field_j


def bc_pos(x):
    return torch.remainder(x, 1.0)


def bc_dpos(x):
    return torch.remainder(x - 0.5, 1.0) - 0.5
The gneralization test data is generated with the above Pytorch Geometric model
Vizualizations of the boids motion can be found in “decomp-gnn/paper_experiments/graphs_data/graphs_boids_16_256_bis/Fig/”
If the simulation is too large, you can set ratio to 1 in kwargs and/or decrease n_particles (multiple of 16) in “boids_16_256_bis.yaml”
p = torch.squeeze(torch.tensor(config.simulation.params))
model = BoidsModel(aggr_type=config.graph_model.aggr_type, p=torch.squeeze(p), bc_dpos=bc_dpos, dimension=config.simulation.dimension)


generate_kwargs = dict(device=device, visualize=True, run_vizualized=0, style='color', alpha=1, erase=True, scenario='stripes', ratio=4, save=True, step=100)

test_kwargs = dict(device=device, visualize=True, style='color', verbose=False, best_model='20', run=0,  ratio=4, sample_embedding=True, step=100, save_velocity=True)

data_generate_particles(config, model, bc_pos, bc_dpos, **generate_kwargs)
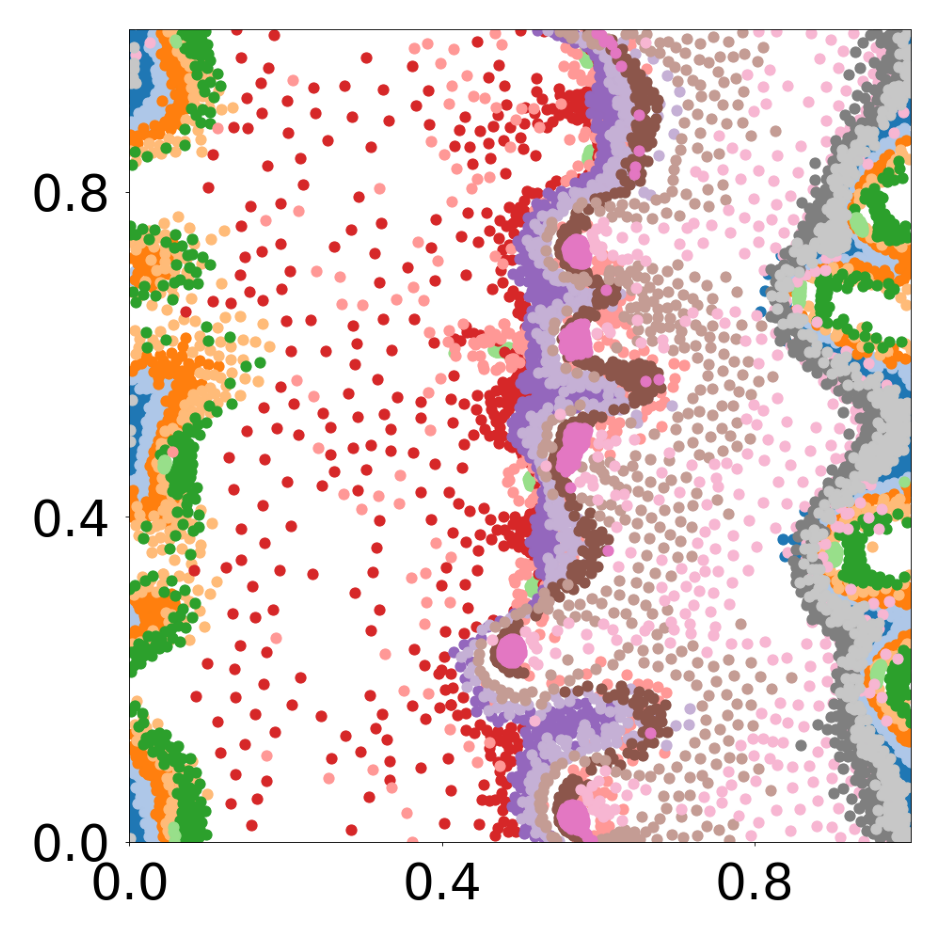


The model that has been trained is used to generate the rollouts from the new dataset.
data_test(config, config_file, **test_kwargs)The results of the GNN is plotted’.
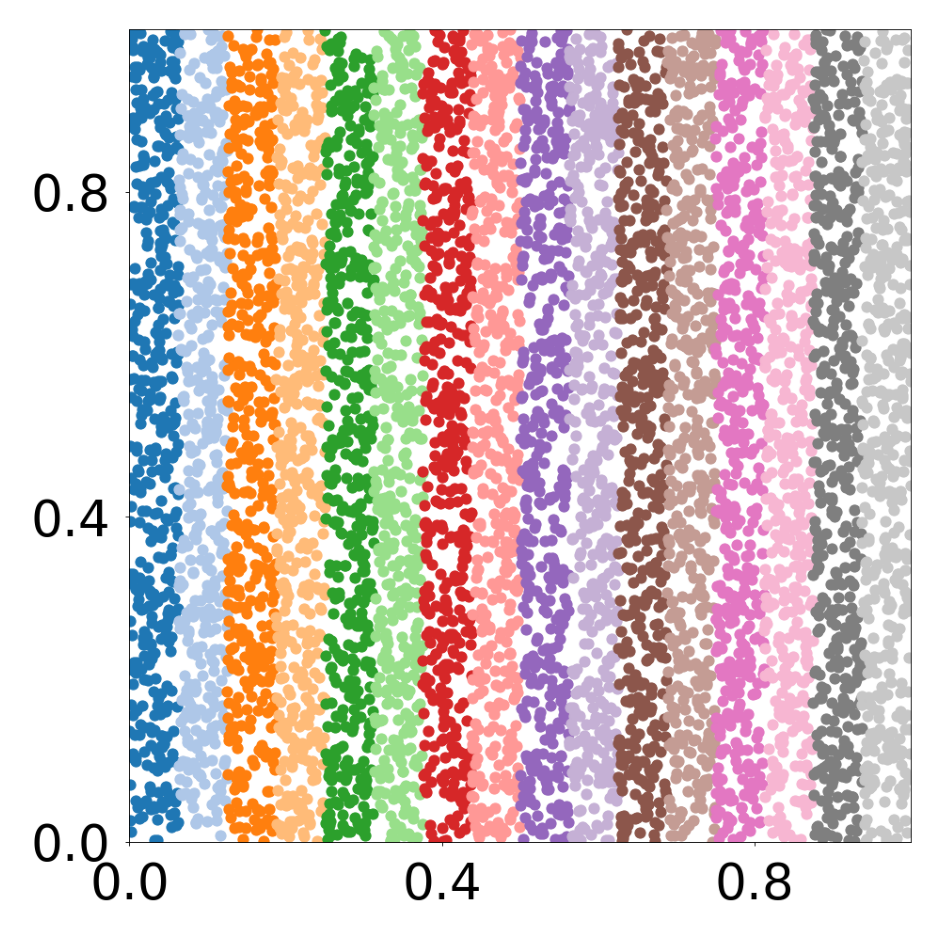

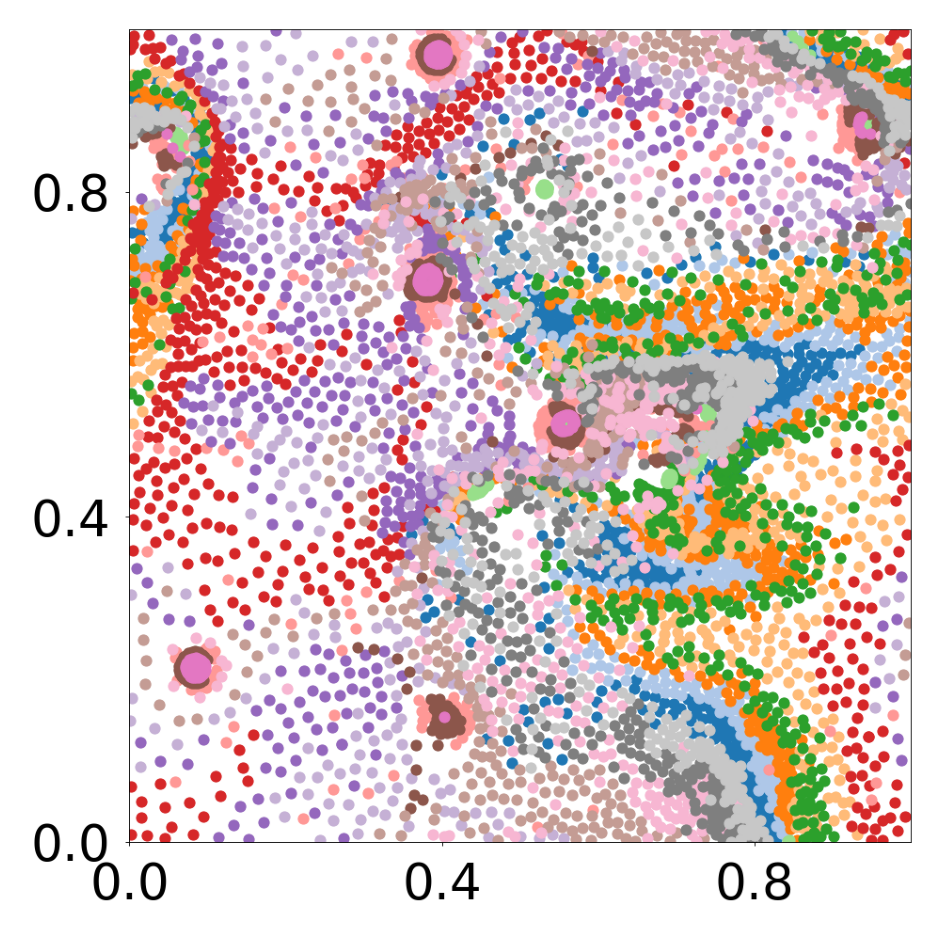
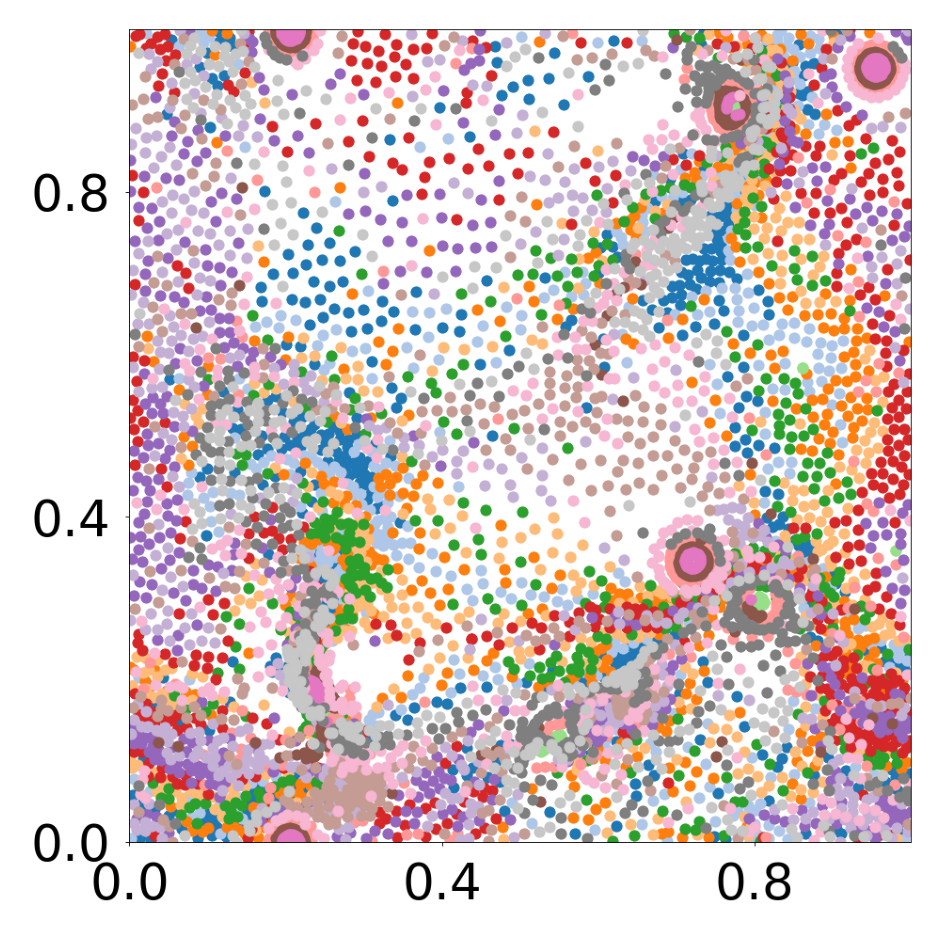
All frames can be found in “decomp-gnn/paper_experiments/log/try_boids_16_256_bis/tmp_recons/”